
How's Your NPS? Find Your NPS Benchmarks
This episode might reference ProfitWell and ProfitWell Recur, which following the acquisition by Paddle is now Paddle Studios. Some information may be out of date.
Originally published: May 9th, 2018
NPS or net promoter score is trending down across the board. But are the products we are building today really worse than they were 5 years ago? As the data suggests, with competition increasing it's getting tougher to drive a memorable experience that returns high NPS, but your brand, support, and speed to ship new features can help.
On this episode of the ProfitWell Report, Christian Holmsen, CEO at Rezstream asks us to look at how NPS has changed over the years and what seem to be the main drivers of higher NPS. To answer Christian's question, let’s look at the NPS data from just over five thousand subscription executives and nearly twenty five thousand consumers.
But first, if you like this kind of content and want to learn more, subscribe to get in the know when we release new episodes.

NPS Trending Down
To not bury the lede - net promoter score across different industries and ARPU levels has actually trended downward over the past five years and when cross referencing roughly a dozen factors, brand, usage, and support satisfaction seem to be the main influencers.
Overall, it’s hard to say the products we buy today are worse than the ones we bought a decade ago.
Yet, NPS data tells a different story.
When looking at NPS in both B2B and B2C aggregated across thousands of companies, note that the average Net Promoter Score five years ago was in the upper 20s and low 30s. With a scale of -100 to 100 that’s pretty good, but the average today has dropped to single digits and low teens. Why has NPS performance dropped regardless of industry?
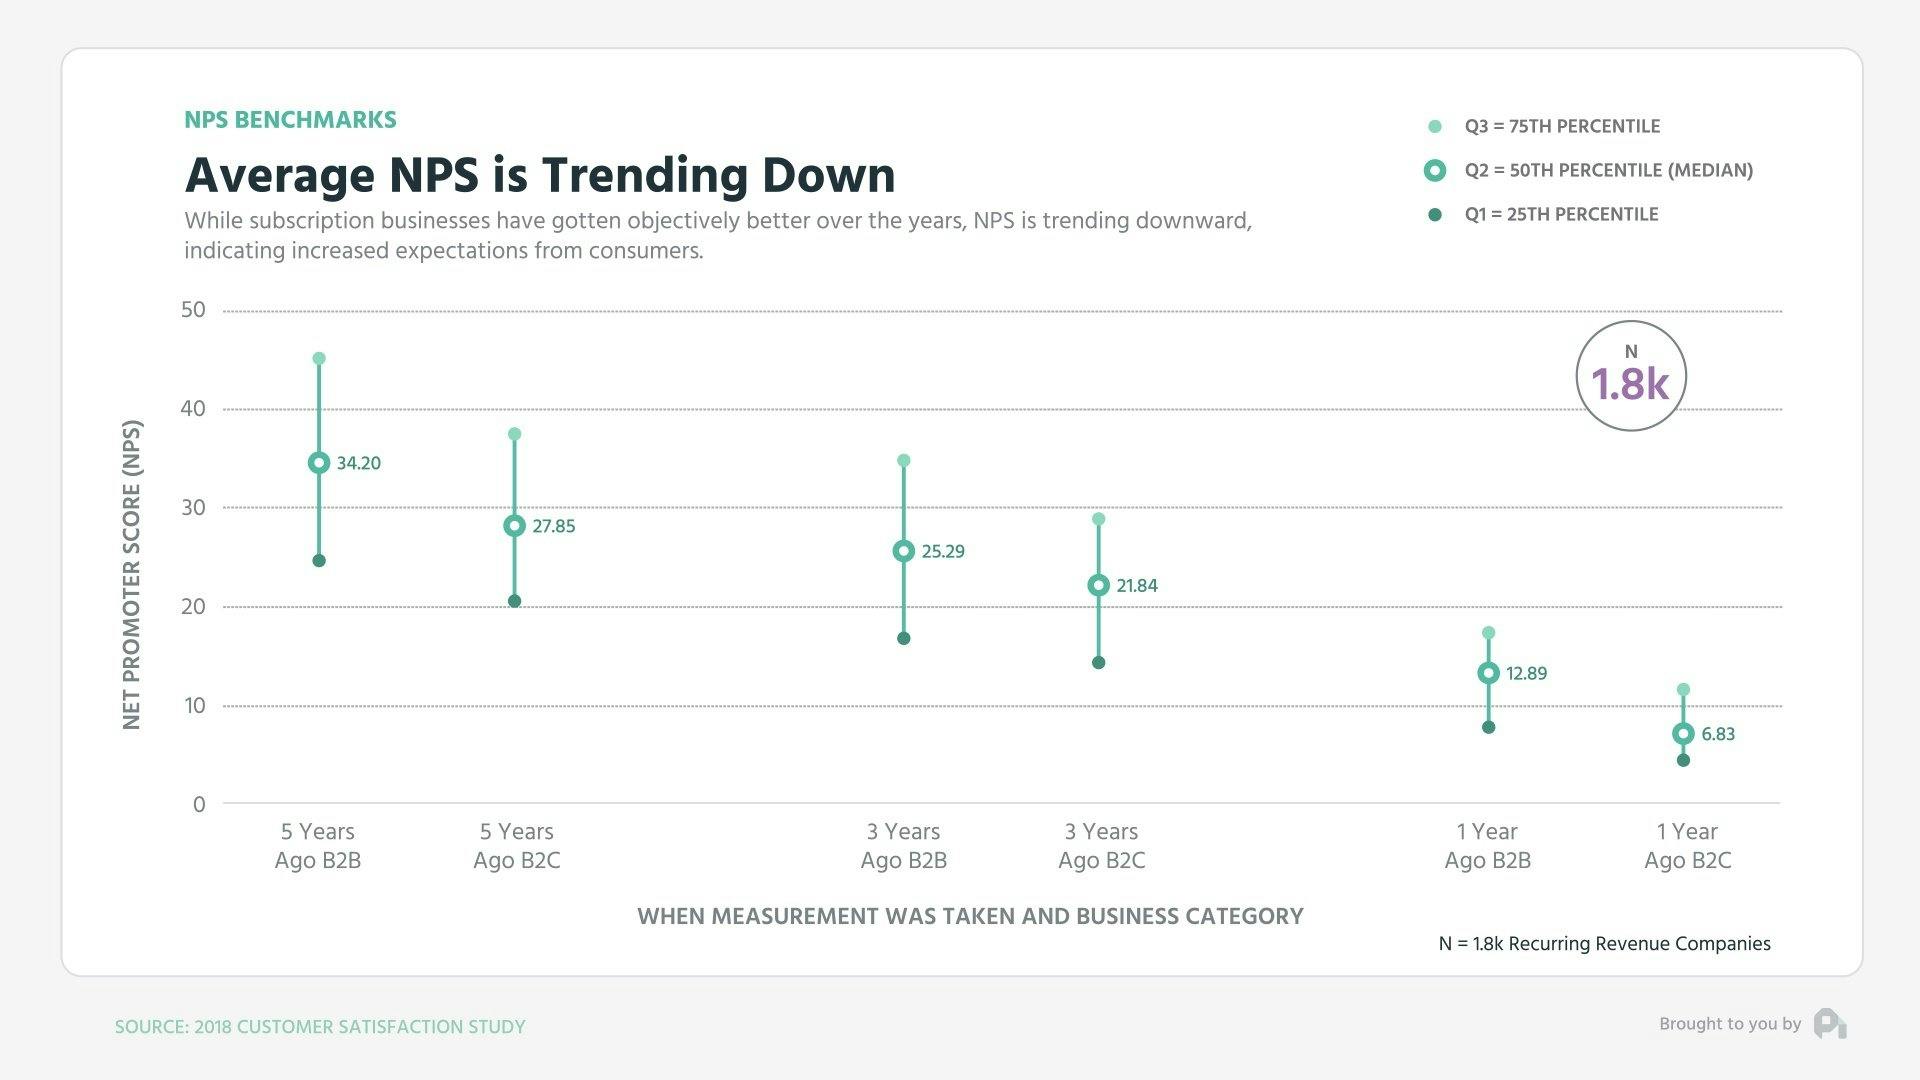
What’s causing the change? Well, frankly consumers have become more and more ungrateful. This isn’t because you’re doing your job worse today than you were five years ago, but you’re certainly in a world where there’s more competition and creating a magical customer experience is just that much harder. But without a great customer experience, you run the risk of creating more customer churn, less customer loyalty, and driving down a good NPS score. And, ultimately, a poor NPS score doesn't bode well for churn and retention rates (regardless of industry).
3 Key Factors to Boost Your NPS
So how do you boost your NPS? When looking at 12 different factors we found you need to focus on brand, support, and the frequency you’re shipping.
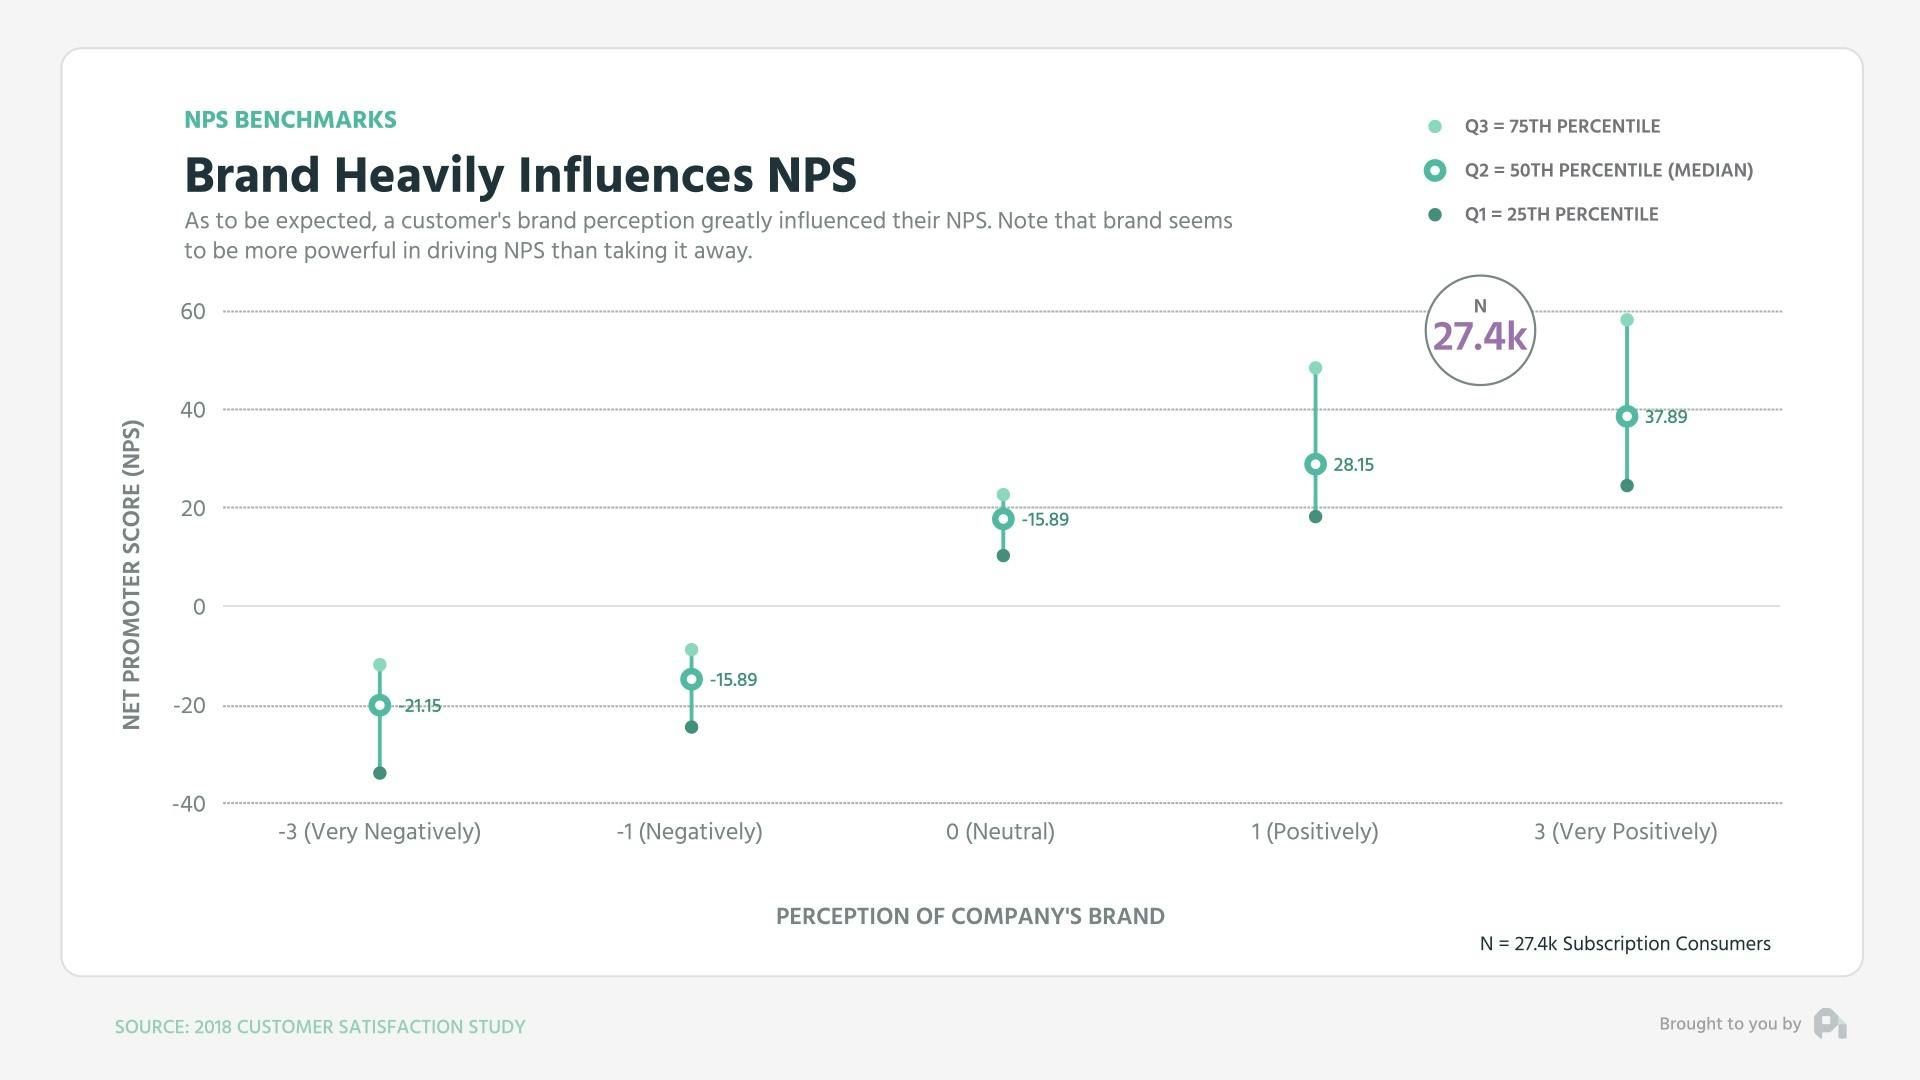
Brand
Brand appeared to drive NPS the most. We coded respondents perception of a company’s brand before measuring their NPS. Those customers who perceived a company’s brand positively had over double the NPS as those who were neutral. Negative perception just tanked NPS as to be expected.
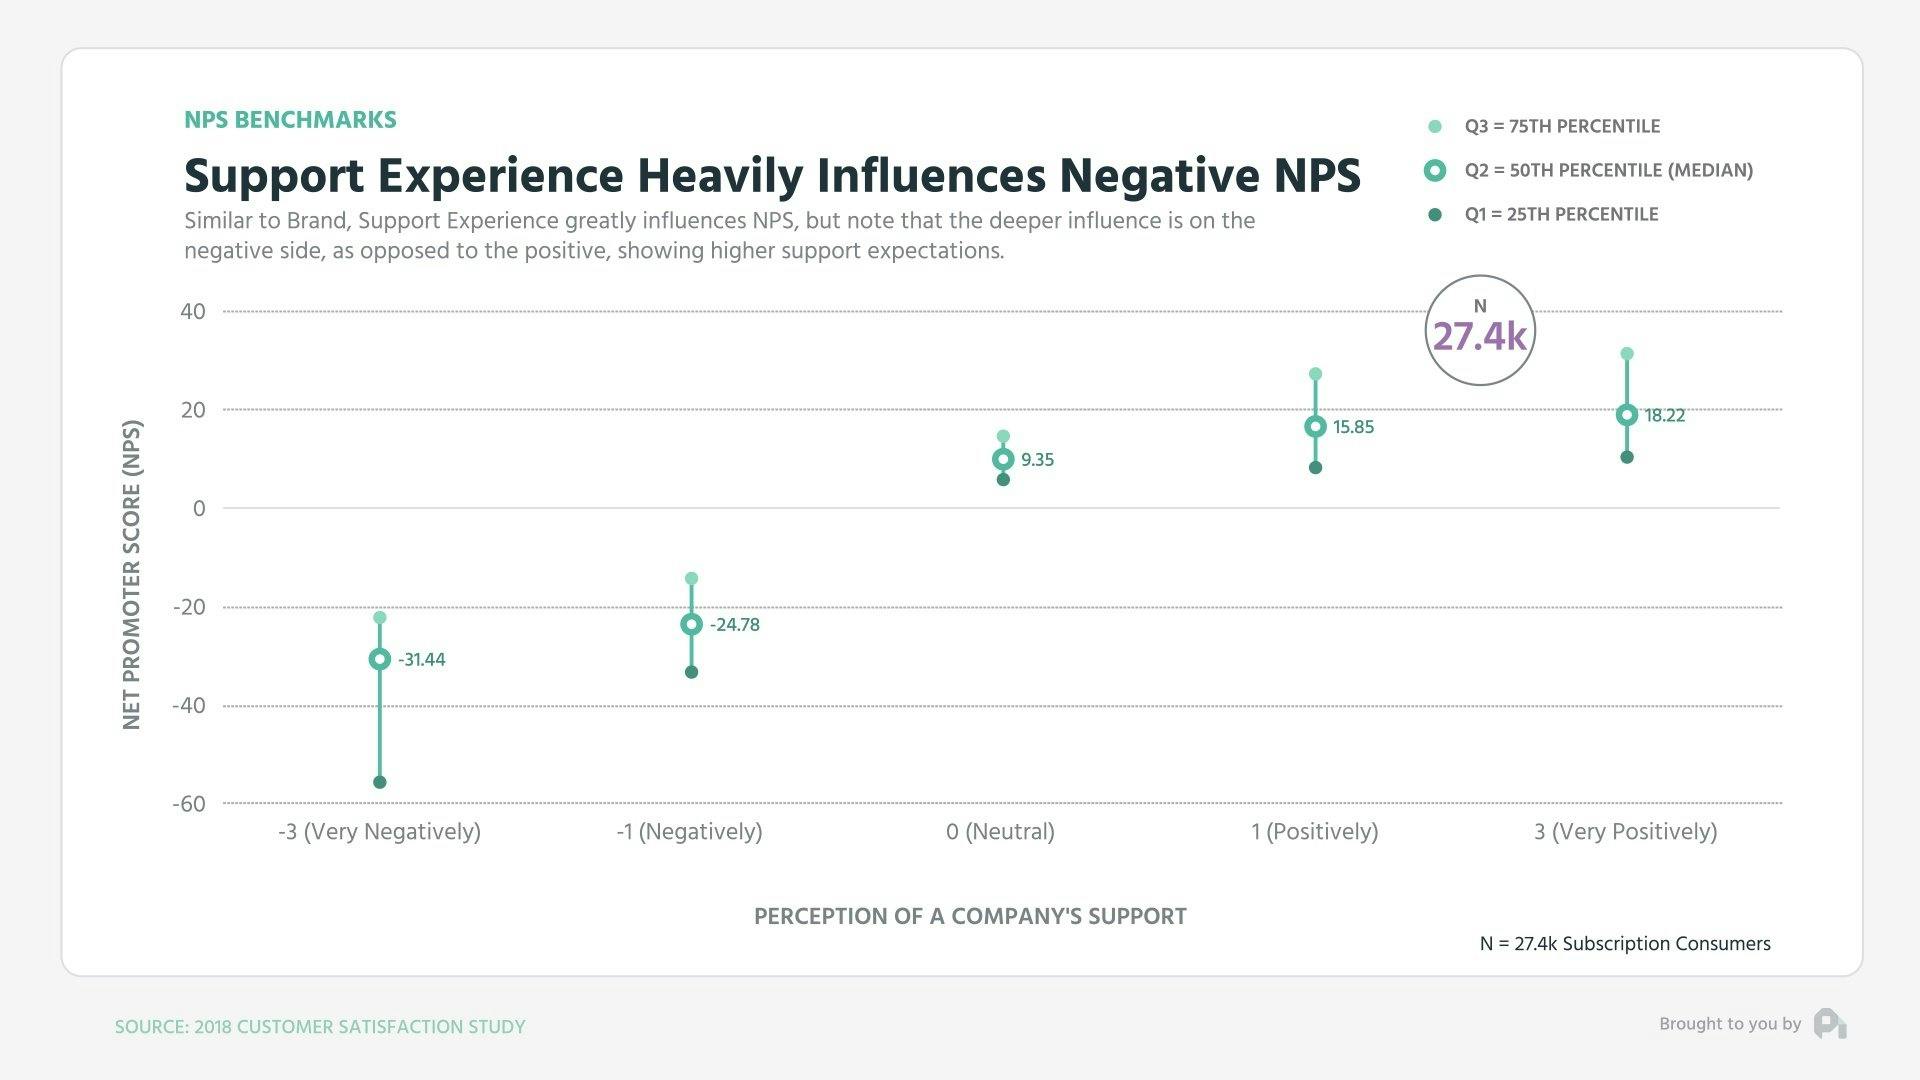
Support experience
Customer service and support perception showed similar results with positive perceptions of a company’s support showing 50-70% higher NPS than those customers with neutral perception.
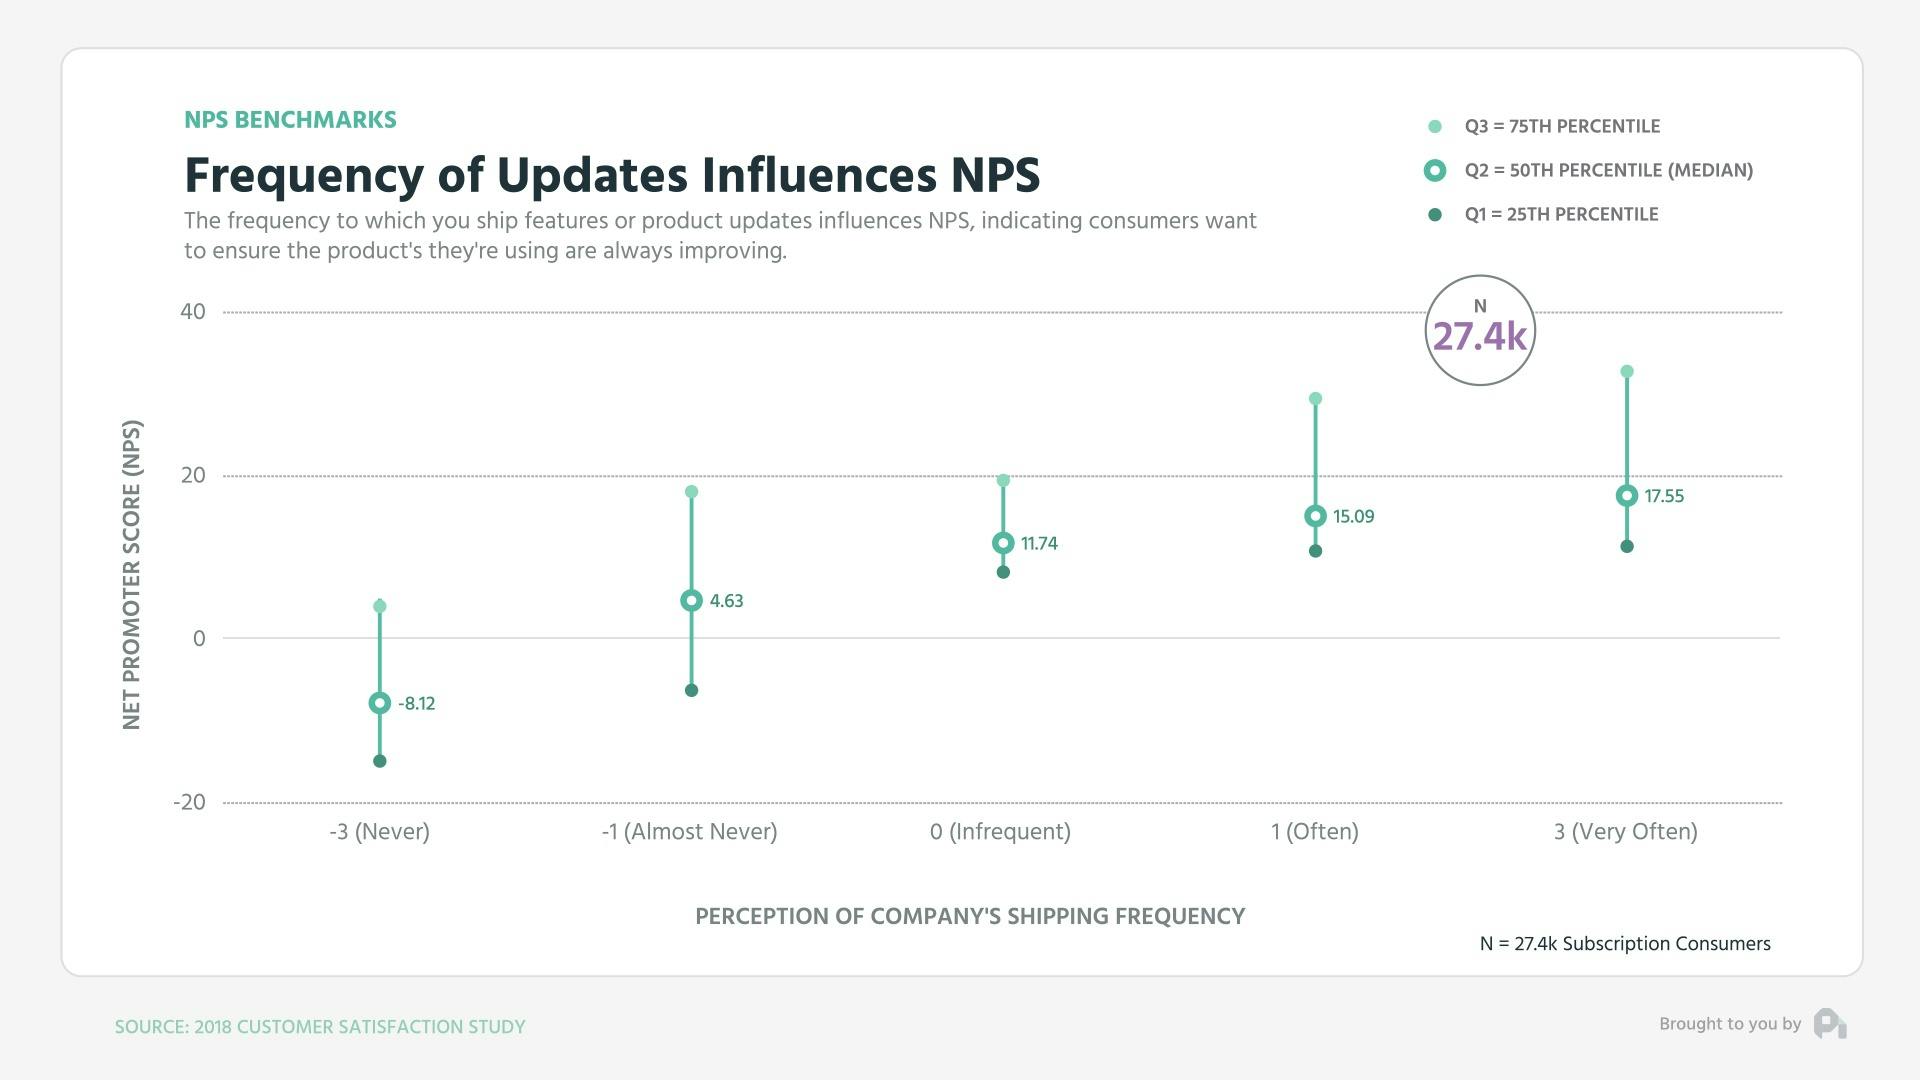
Frequency of updates
Finally, the frequency at which you ship new features or products showed a positive trend, as well with customers who perceived the company as shipping new features and functionality often having 30-40% higher NPS than those who perceived the company as shipping infrequently.
Of course, many of these factors compound on one another, but in isolation the story they tell is that momentum and brand is crucial to customer satisfaction. Long gone are the days where a product just needed to work in order for your customer to love you and the expectations will continue to increase as the B2B and B2C products in our world of recurring revenue become more and more magical. The important part is getting feedback from customers on your NPS survey. Without feedback and responses, you'll have no way to measure your improvements.
Want to learn more? Check out our recent episode: Driving Higher ARPU at Signup with Value Metrics and subscribe to the show to get new episodes.
1
00:00:00,320 --> 00:00:03,520
You've got the questions,
and we have the data.
2
00:00:03,520 --> 00:00:06,620
This is the ProfitWell Report.
3
00:00:08,255 --> 00:00:11,194
Hey, Patrick. Christian
from Rezstream here.
4
00:00:11,215 --> 00:00:15,260
We recently implemented an
NPS tool to better track
5
00:00:15,260 --> 00:00:17,340
satisfaction amongst
our hotel clients.
6
00:00:17,340 --> 00:00:22,685
So my question to you is, how
has NPS changed over the years?
7
00:00:22,685 --> 00:00:24,925
And what seems to be the main
drivers in your overview?
8
00:00:24,925 --> 00:00:25,885
Great question, Christian.
9
00:00:25,885 --> 00:00:29,325
Because NPS or Net Promoter
Score has been something that's
10
00:00:29,325 --> 00:00:31,630
been fascinating
for quite some time.
11
00:00:31,630 --> 00:00:32,510
To answer your question,
12
00:00:32,510 --> 00:00:34,910
let's look at the NPS data
from just over five thousand
13
00:00:34,910 --> 00:00:37,310
subscription companies and
nearly twenty five thousand
14
00:00:37,310 --> 00:00:38,605
subscription consumers.
15
00:00:38,605 --> 00:00:38,845
To
16
00:00:38,845 --> 00:00:39,565
not bear the lead,
17
00:00:39,565 --> 00:00:42,205
Net Promoter Score across
different industries at ARPU
18
00:00:42,205 --> 00:00:45,245
levels has actually trended
downward over the past five years.
19
00:00:45,245 --> 00:00:48,050
And when cross referencing
roughly a dozen factors,
20
00:00:48,050 --> 00:00:50,670
brand usage and
support satisfaction
21
00:00:50,690 --> 00:00:52,370
seem to be the main influencers.
22
00:00:52,370 --> 00:00:52,770
Overall,
23
00:00:52,770 --> 00:00:55,330
it's hard to say that products
that we buy today are worse
24
00:00:55,330 --> 00:00:57,305
than the ones we
bought a decade ago.
25
00:00:57,305 --> 00:00:59,785
Yet, NPS data tells
a different story.
26
00:00:59,785 --> 00:01:02,825
When looking at NPS in both
b to b and b to c aggregated
27
00:01:02,825 --> 00:01:04,570
across thousands of companies,
28
00:01:04,570 --> 00:01:07,370
note that the average NPS score
five years ago was in the upper
29
00:01:07,370 --> 00:01:08,970
twenties and low thirties.
30
00:01:08,970 --> 00:01:11,130
With a scale of negative
a hundred to a hundred,
31
00:01:11,130 --> 00:01:11,985
that's pretty good.
32
00:01:11,985 --> 00:01:16,045
But the average today has dropped
to single digits in low teens.
33
00:01:16,145 --> 00:01:17,985
So what's causing this change?
34
00:01:17,985 --> 00:01:21,810
Well, frankly, consumers have
become more and more ungrateful.
35
00:01:21,810 --> 00:01:24,130
This isn't because you're doing
your job worse today than you
36
00:01:24,130 --> 00:01:25,330
were five years ago,
37
00:01:25,330 --> 00:01:27,810
but you're certainly in a world
where more competition and
38
00:01:27,810 --> 00:01:31,305
creating magical experiences
is is just that much harder.
39
00:01:31,305 --> 00:01:31,545
So
40
00:01:31,545 --> 00:01:33,065
how do you boost your NPS?
41
00:01:33,065 --> 00:01:34,585
When looking at twelve
different factors,
42
00:01:34,585 --> 00:01:36,985
we found you need to
focus on brand, support,
43
00:01:36,985 --> 00:01:38,950
and the frequency
you're shipping.
44
00:01:38,950 --> 00:01:40,790
Brand appeared to
drive NPS the most.
45
00:01:40,790 --> 00:01:43,190
We quoted respondents
perception of a company's brand
46
00:01:43,190 --> 00:01:45,030
before measuring their NPS.
47
00:01:45,030 --> 00:01:48,390
Those consumers who perceive
a company's brand positively had
48
00:01:48,390 --> 00:01:51,335
over double the NPS as
those who were neutral.
49
00:01:51,335 --> 00:01:55,095
Negative perception just
tanked NPS as to be expected.
50
00:01:55,095 --> 00:01:57,735
Support perception showed
similar results with positive
51
00:01:57,735 --> 00:02:00,760
perceptions of company support
showing fifty to seventy
52
00:02:00,760 --> 00:02:04,600
percent higher NPS than those
customers with neutral perceptions.
53
00:02:04,600 --> 00:02:08,925
Finally, the frequency at which you ship
new features or products showed a positive
54
00:02:11,125 --> 00:02:13,925
shipping new features and
functionality often having
55
00:02:13,925 --> 00:02:17,125
thirty to forty percent higher
NPS than those who perceive the
56
00:02:17,125 --> 00:02:19,200
company as shipping
infrequently.
57
00:02:19,200 --> 00:02:19,440
Of
58
00:02:19,440 --> 00:02:22,480
course, many of these factors
compound on one another.
59
00:02:22,480 --> 00:02:23,440
But in isolation,
60
00:02:23,440 --> 00:02:26,675
the story they tell us is
that momentum and brand are crucial
61
00:02:26,675 --> 00:02:28,575
to customer satisfaction.
62
00:02:28,595 --> 00:02:31,235
Long gone are the days where
a product just needed to work in
63
00:02:31,235 --> 00:02:32,755
order for a customer
to love you,
64
00:02:32,755 --> 00:02:35,470
and the expectations will
continue to increase as the b
65
00:02:35,470 --> 00:02:38,990
to b and b to c products in
our world of recurring revenue
66
00:02:38,990 --> 00:02:40,830
become more and more magical.
67
00:02:40,830 --> 00:02:41,070
Well,
68
00:02:41,070 --> 00:02:41,870
that's all for now.
69
00:02:41,870 --> 00:02:42,750
If you have a question,
70
00:02:42,750 --> 00:02:45,545
shoot me an email or video
to p c at profitable dot com.
71
00:02:45,545 --> 00:02:48,265
Let's also thank Christian from
RezStream here for sparking
72
00:02:48,265 --> 00:02:51,200
this research by by clicking on the
link below to give him some love.
73
00:02:51,200 --> 00:02:53,100
We'll see you next week.


