How Do Subscription Companies in EU Differ from Those in the USA?
This episode might reference ProfitWell and ProfitWell Recur, which following the acquisition by Paddle is now Paddle Studios. Some information may be out of date.
Originally published: July 19th, 2019
Subscription and SaaS ecosystems have popped up–and flourished–everywhere in the past few decades. While the United States continues to dominate when it comes to the subscription economy, Europe in particular is enjoying an upswing in the past few years spurred by the ecosystem getting injected with talent coming from the European headquarters of U.S. tech companies.
The problem is, looking at Europe as one block is a bit tough.
But first, if you like this kind of content and want to learn more, subscribe to get in the know when we release new episodes.

The U.K., Western Europe, Eastern Europe, and Scandinavia all act a bit differently, particularly in what they prioritize within their companies. For instance, Eastern European companies tend to be very efficient and resourceful, a result of dealing with older equipment in the post-Soviet era, while the Nordics are very much focused on design and experience.
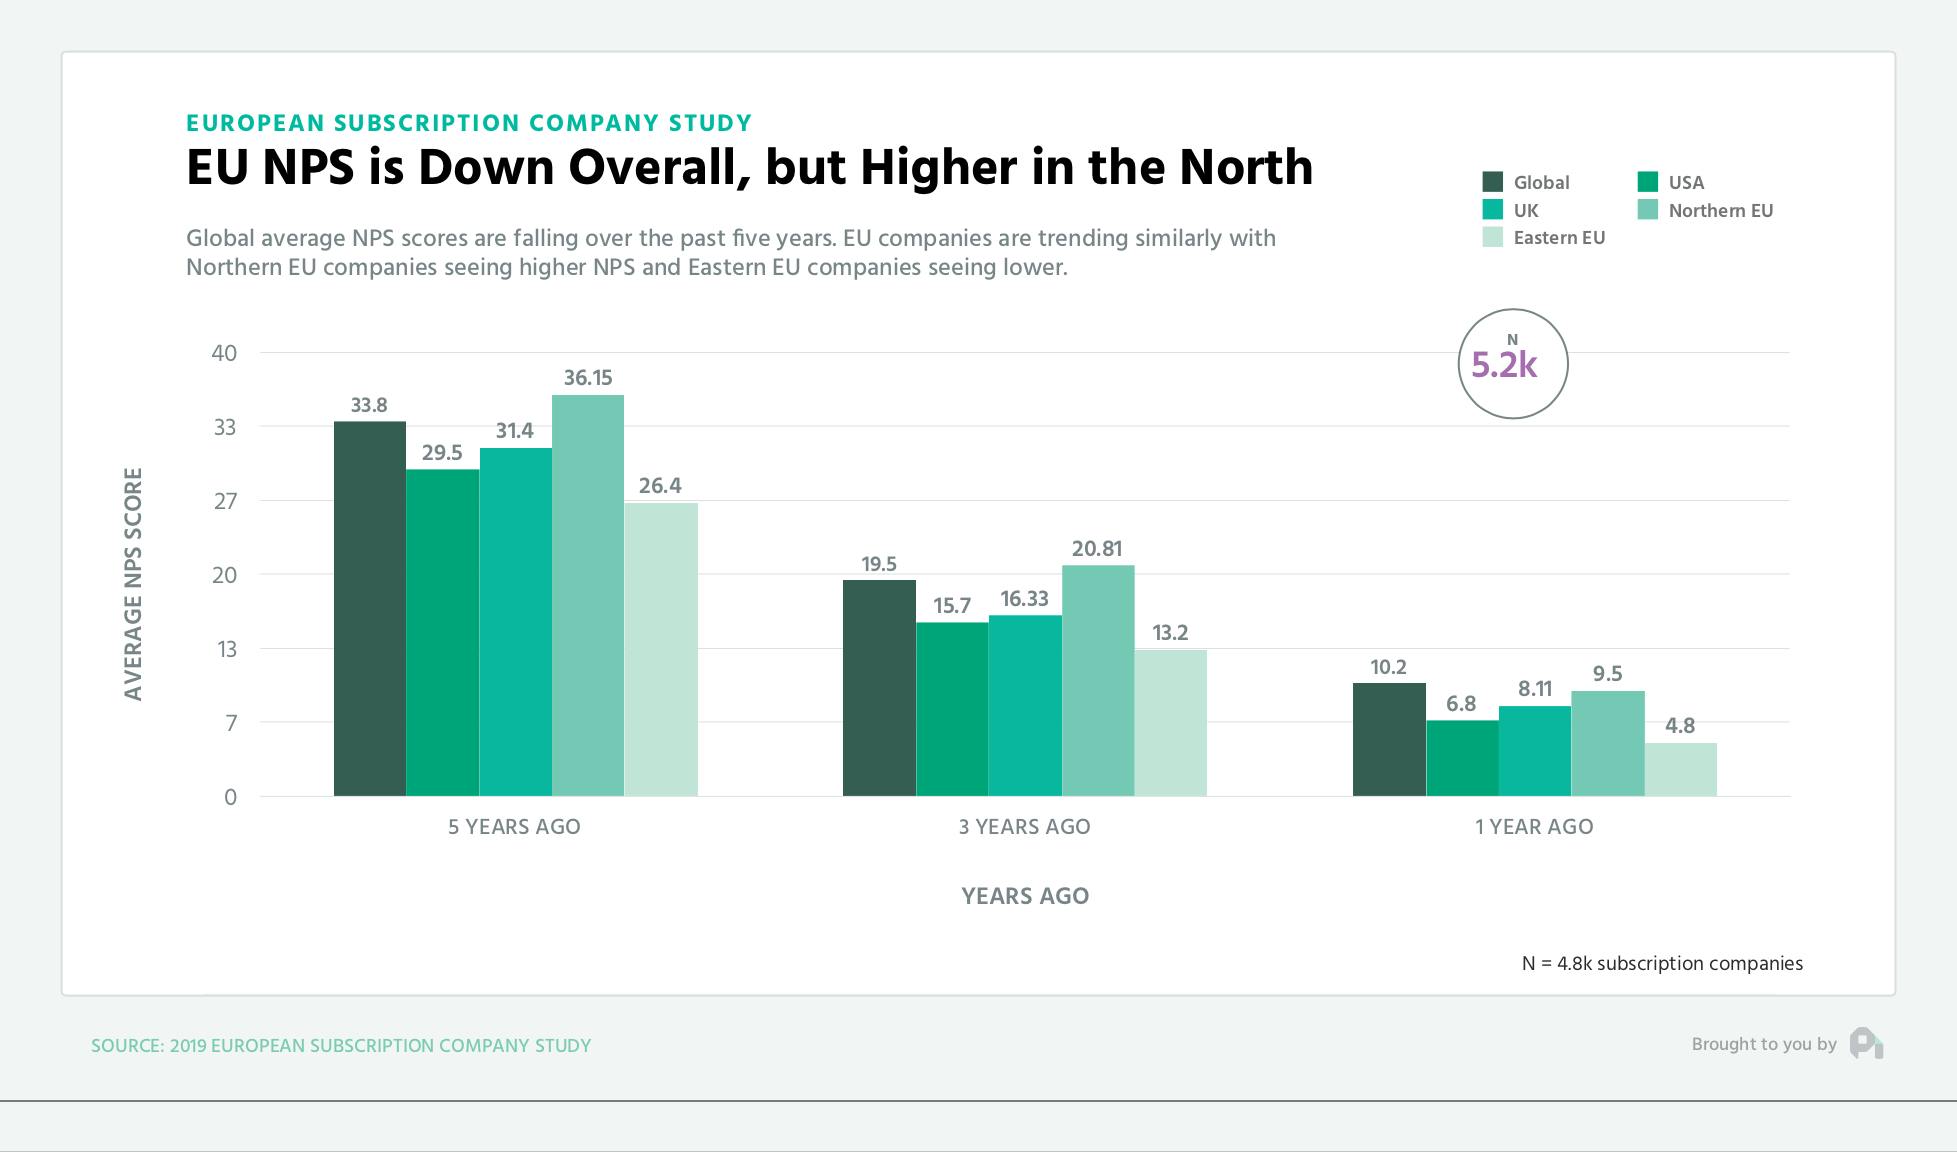
You see these differences pop up when comparing net promoter scores, a measure of customer satisfaction. Note that while NPS has gone down across the board, U.K. NPS tracks essentially spot on with U.S. NPS, Northern European subscription companies tend to see 20% higher NPS, and Eastern European companies see 15% lower NPS.

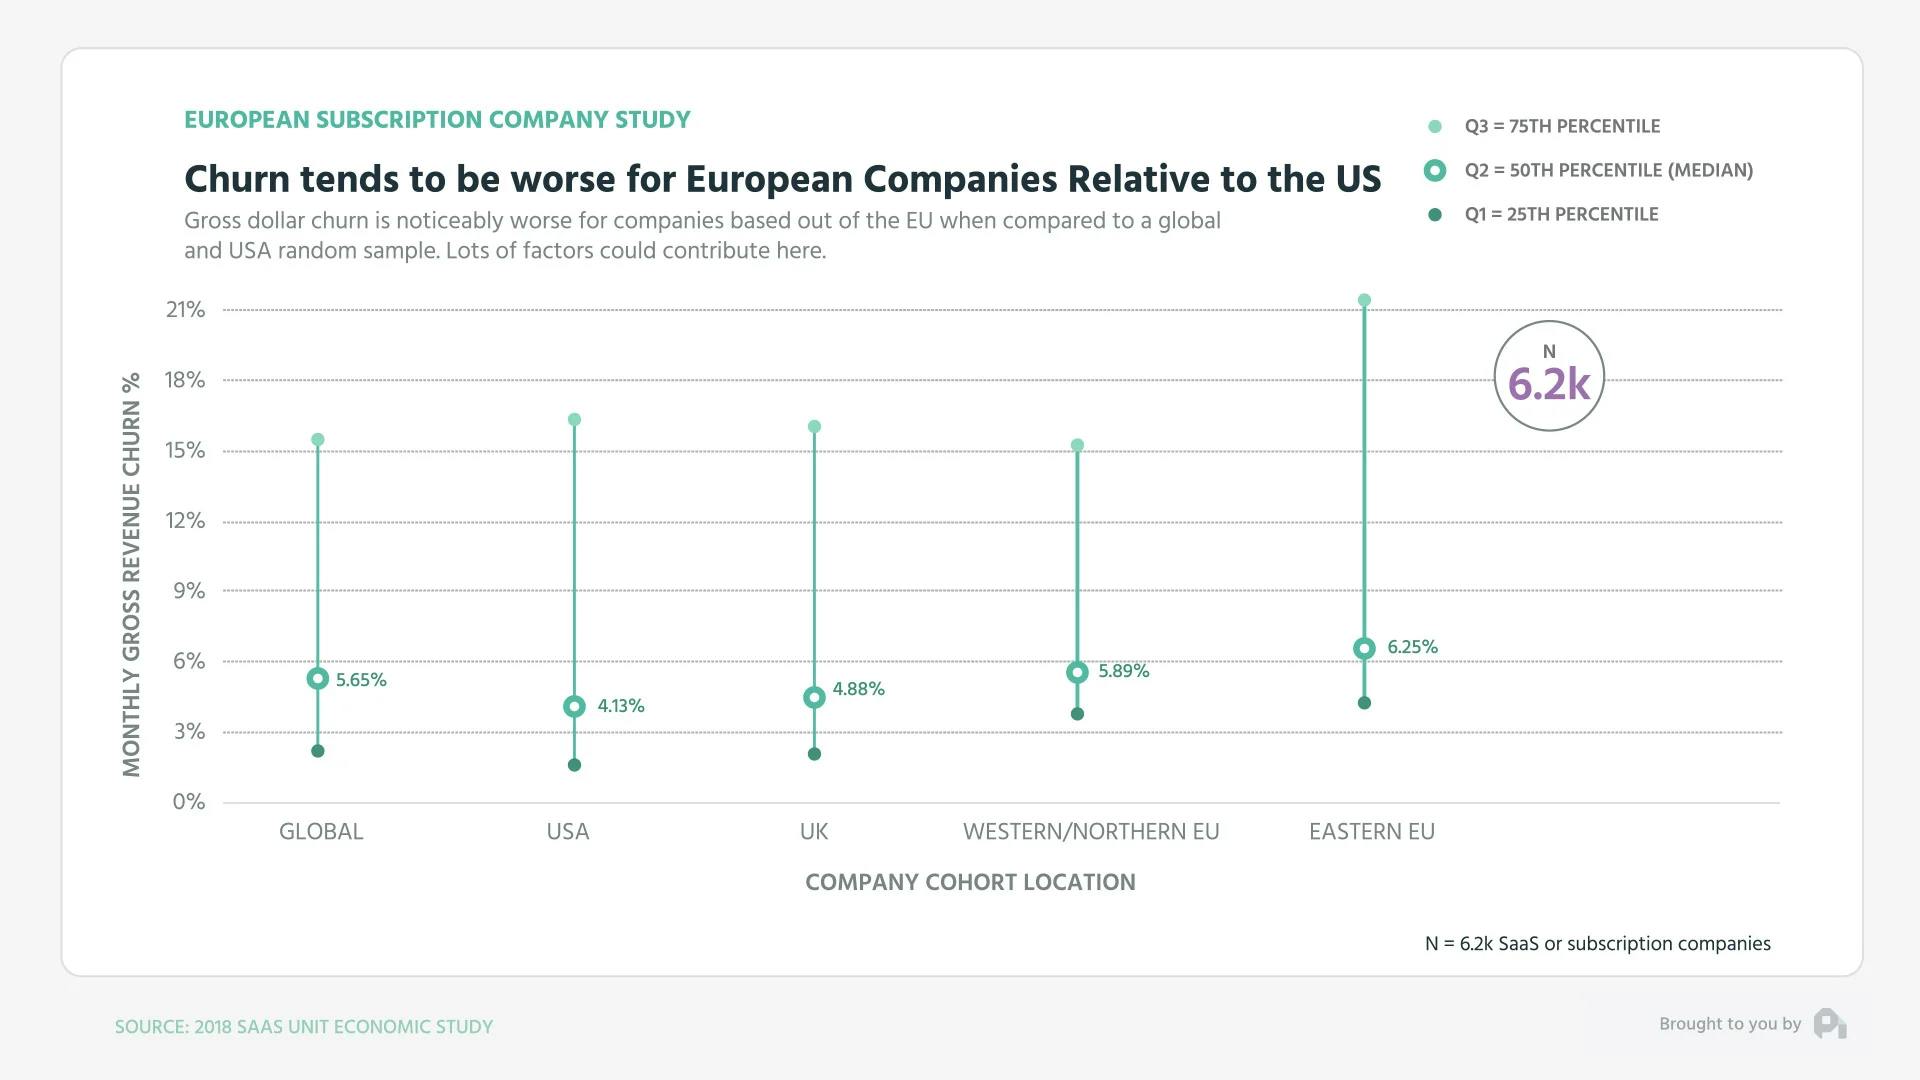
You see a similar relationship when comparing retention numbers as well. Gross revenue retention across Europe is actually much worse than subscription companies in the United States, with Eastern European companies seeing roughly 25% higher churn, the Nordics and Western Europe seeing roughly 15% higher churn, and the U.K. tracking at about 5 to 10% higher than their U.S. counterparts.

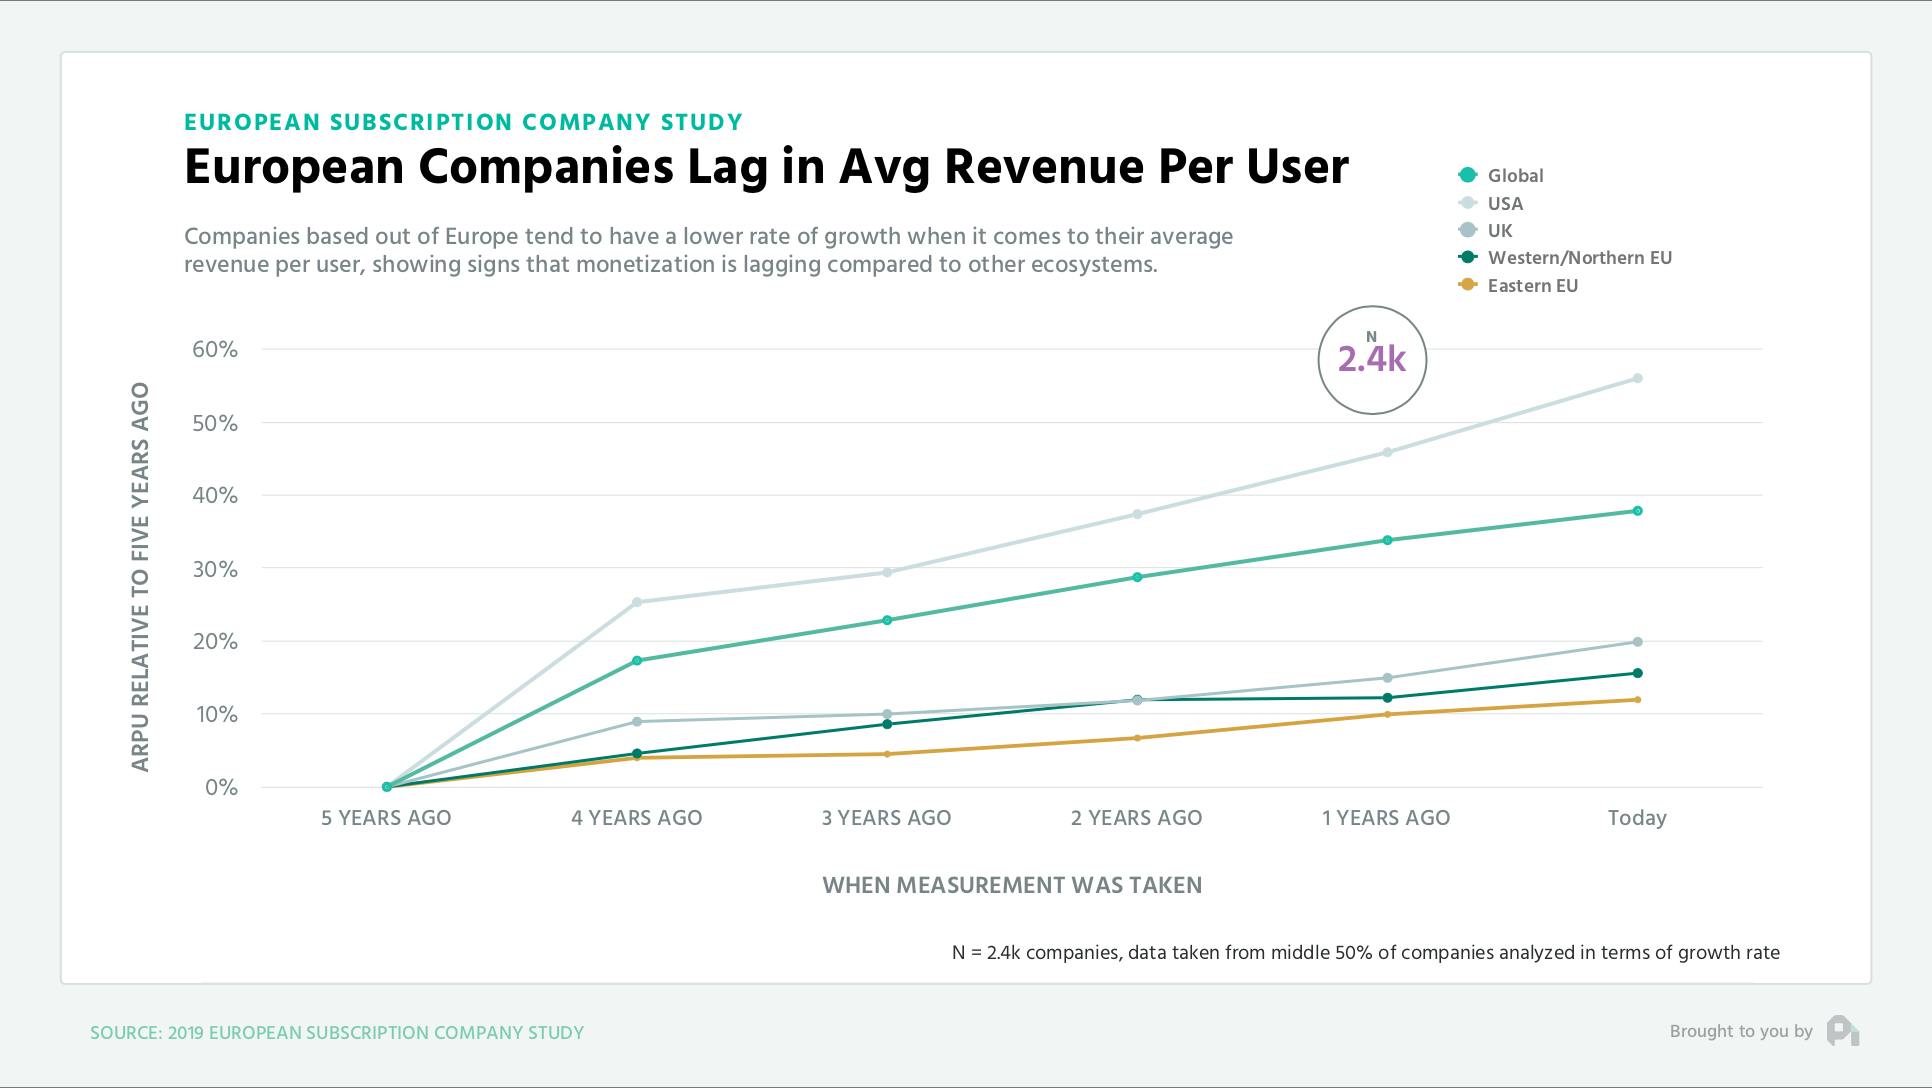
Further, the differences also exist when looking at the growth of company average revenue per user, which is an individualized proxy for how good or bad a company is at extracting value from their target customer base. Note that across the board, ARPU remains relatively flat, with the U.K., Nordics, and Western Europe seeing some gains, but they’re very minimal, and Eastern Europe actually seeing their collective ARPU decrease over time.

So is Europe doomed as a subscription and SaaS ecosystem? Well, of course not. We need to keep in mind that while Europe has been around for much longer than the United States, the subscription and SaaS markets are much younger than American ones, resulting in Europe being slightly behind the times when it comes to the tactics and strategies needed to grow a subscription business.
Sure, the internet reduces those barriers considerably, but the talent gap is where the impact truly exists. With time this will continue to close and I’m sure these numbers will look much cleaner as we continue to march into the adolescence of the subscription economy.
Want to learn more? Check out our recent episode on How Australian Companies Differ from US Companies and subscribe to the show to get new episodes.

1
00:00:00,320 --> 00:00:03,520
You've got the questions,
and we have the data.
2
00:00:03,520 --> 00:00:06,620
This is the ProfitWell Report.
3
00:00:08,625 --> 00:00:09,265
Hey, Neil.
4
00:00:09,265 --> 00:00:13,185
This is Chris from Visibly,
and I would like to ask, how do
5
00:00:13,185 --> 00:00:16,760
EU subscription companies
differ from the US?
6
00:00:16,880 --> 00:00:19,440
Welcome back, everyone.
Neil here from ProfitWell.
7
00:00:19,440 --> 00:00:22,160
Subscription and SaaS
ecosystems have popped up and
8
00:00:22,160 --> 00:00:24,880
flourished everywhere in
the past couple of decades,
9
00:00:24,880 --> 00:00:26,865
riding the wave of
interconnectedity brought by
10
00:00:26,865 --> 00:00:28,465
the Internet and social media.
11
00:00:28,465 --> 00:00:30,625
While the United States
continues to dominate when it
12
00:00:30,625 --> 00:00:32,625
comes to the
subscription economy,
13
00:00:32,625 --> 00:00:35,420
Europe in particular is
enjoying an upswing in the past
14
00:00:35,420 --> 00:00:38,380
few years spurred by the
ecosystem getting injected with
15
00:00:38,380 --> 00:00:40,620
talent that's strafing off
from the US tech company,
16
00:00:40,620 --> 00:00:42,115
European headquarters.
17
00:00:42,115 --> 00:00:44,995
Let's explore how European
subscription economies stack up
18
00:00:44,995 --> 00:00:47,875
to their US counterparts by
looking at the data from over
19
00:00:47,875 --> 00:00:50,010
five thousand
subscription companies.
20
00:00:50,290 --> 00:00:53,890
Looking at Europe as one block
is a bit tough because the UK,
21
00:00:53,890 --> 00:00:55,490
Western Europe, Eastern Europe,
22
00:00:55,490 --> 00:00:57,925
and Northern Europe all
act a bit differently,
23
00:01:05,085 --> 00:01:08,080
result of dealing with older
equipment in the past Soviet area,
24
00:01:08,080 --> 00:01:11,280
while the Nordics are a bit more
focused on design and experience.
25
00:01:11,280 --> 00:01:13,840
You see these differences pop
up when comparing net promoter
26
00:01:13,840 --> 00:01:16,335
score, a measure of
customer satisfaction.
27
00:01:16,335 --> 00:01:20,255
Note that while NPS has gone
down across the board, UK NPS
28
00:01:20,255 --> 00:01:22,839
tracks essentially
spot on with US NPS.
29
00:01:22,839 --> 00:01:25,477
Northern European subscription
companies tend to see twenty
30
00:01:25,477 --> 00:01:26,467
percent higher NPS,
31
00:01:26,467 --> 00:01:29,755
and Eastern European companies
see fifteen percent lower NPS.
32
00:01:29,755 --> 00:01:33,515
You see a similar relationship when
comparing retention numbers as well.
33
00:01:33,515 --> 00:01:36,635
Gross revenue retention across
Europe is actually much worse
34
00:01:36,635 --> 00:01:38,670
than subscription
companies in the US,
35
00:01:38,670 --> 00:01:41,230
with Eastern European companies
seeing roughly twenty five
36
00:01:41,230 --> 00:01:42,430
percent higher churn,
37
00:01:42,430 --> 00:01:45,525
the Nordics in Western Europe seeing
roughly fifteen percent higher churn,
38
00:01:45,525 --> 00:01:48,085
and the UK tracking at about
five to ten percent higher than
39
00:01:48,085 --> 00:01:49,665
the US counterparts.
40
00:01:50,005 --> 00:01:52,965
Further, the differences also
exist when looking at the growth of
41
00:01:52,965 --> 00:01:54,570
average revenue per user,
42
00:01:54,570 --> 00:01:57,690
which is an individualized
proxy for how good or bad a
43
00:01:57,690 --> 00:02:00,970
company is extracting value
from the target customer base.
44
00:02:00,970 --> 00:02:02,625
Note that across the board,
45
00:02:02,625 --> 00:02:05,345
remains relatively flat
with the UK, Nordics,
46
00:02:05,345 --> 00:02:07,185
and Western Europe
seeing some gains,
47
00:02:07,185 --> 00:02:08,705
but they're very minimal,
48
00:02:08,705 --> 00:02:11,430
and Eastern Europe actually
seeing their collective ARPU
49
00:02:11,430 --> 00:02:12,550
decrease over time.
50
00:02:12,550 --> 00:02:15,990
So is Europe doomed as a
subscription and SaaS ecosystem?
51
00:02:15,990 --> 00:02:17,270
Well, of course not.
52
00:02:17,270 --> 00:02:19,925
We need to keep in mind
that while Europe has been
53
00:02:21,325 --> 00:02:21,574
around for much
longer than the US,
54
00:02:21,574 --> 00:02:23,485
the subscription and SaaS
markets are much younger than
55
00:02:23,485 --> 00:02:24,605
most of the US,
56
00:02:24,605 --> 00:02:27,085
resulting in Europe being
slightly behind the times when
57
00:02:27,085 --> 00:02:29,820
it comes to the tactics and
strategies needed to grow
58
00:02:29,820 --> 00:02:31,180
subscription business.
59
00:02:31,180 --> 00:02:31,500
Sure.
60
00:02:31,500 --> 00:02:33,980
The Internet reduces those
barriers considerably,
61
00:02:33,980 --> 00:02:37,340
but the talent gap is where
the impact truly exists.
62
00:02:37,340 --> 00:02:39,165
With time, this this
will continue to close,
63
00:02:39,165 --> 00:02:41,405
and I'm sure that those numbers
will look much cleaner as we
64
00:02:41,405 --> 00:02:45,385
continue to march into the adolescence
of the subscription economy.
65
00:02:45,450 --> 00:02:46,810
Well, that's it for now.
66
00:02:46,810 --> 00:02:47,850
If you have any questions,
67
00:02:47,850 --> 00:02:50,810
send me an email or video
to neil at profit well dot com.
68
00:02:50,810 --> 00:02:53,050
If you got value today
or any other report,
69
00:02:53,050 --> 00:02:55,635
we appreciate you sharing
on Twitter and LinkedIn because
70
00:02:55,635 --> 00:02:57,315
that's how we know
to keep going.
71
00:02:57,315 --> 00:02:59,615
Thanks, and I'll
see you next week.
72
00:03:01,475 --> 00:03:04,160
This week's episode is
brought to you by MasterClass,
73
00:03:04,160 --> 00:03:06,960
online class taught by the
world's greatest minds.
74
00:03:06,960 --> 00:03:09,020
MasterClass dot com.


