
Is All Software Going to $0?
This episode might reference ProfitWell and ProfitWell Recur, which following the acquisition by Paddle is now Paddle Studios. Some information may be out of date.
Originally published: April 17th, 2019
To answer this question, we looked at over 2 million customers and their preferences around features and willingness to pay, and here’s what we found.
Similar to the price of computers and memory, software prices have declined substantially since the 1980s and especially since the 90s and early 2000s when the cloud started to go mainstream. Costs have come down, buyer sophistication has increased, and information has become more symmetrical between buyers and sellers.
Where’s the floor though? After all, understanding the value cycles when it comes to features and functionality is crucial to ensuring you can defend your price.
Well, software value is certainly declining.
But first, if you like this kind of content and want to learn more, subscribe to get in the know when we release new episodes.

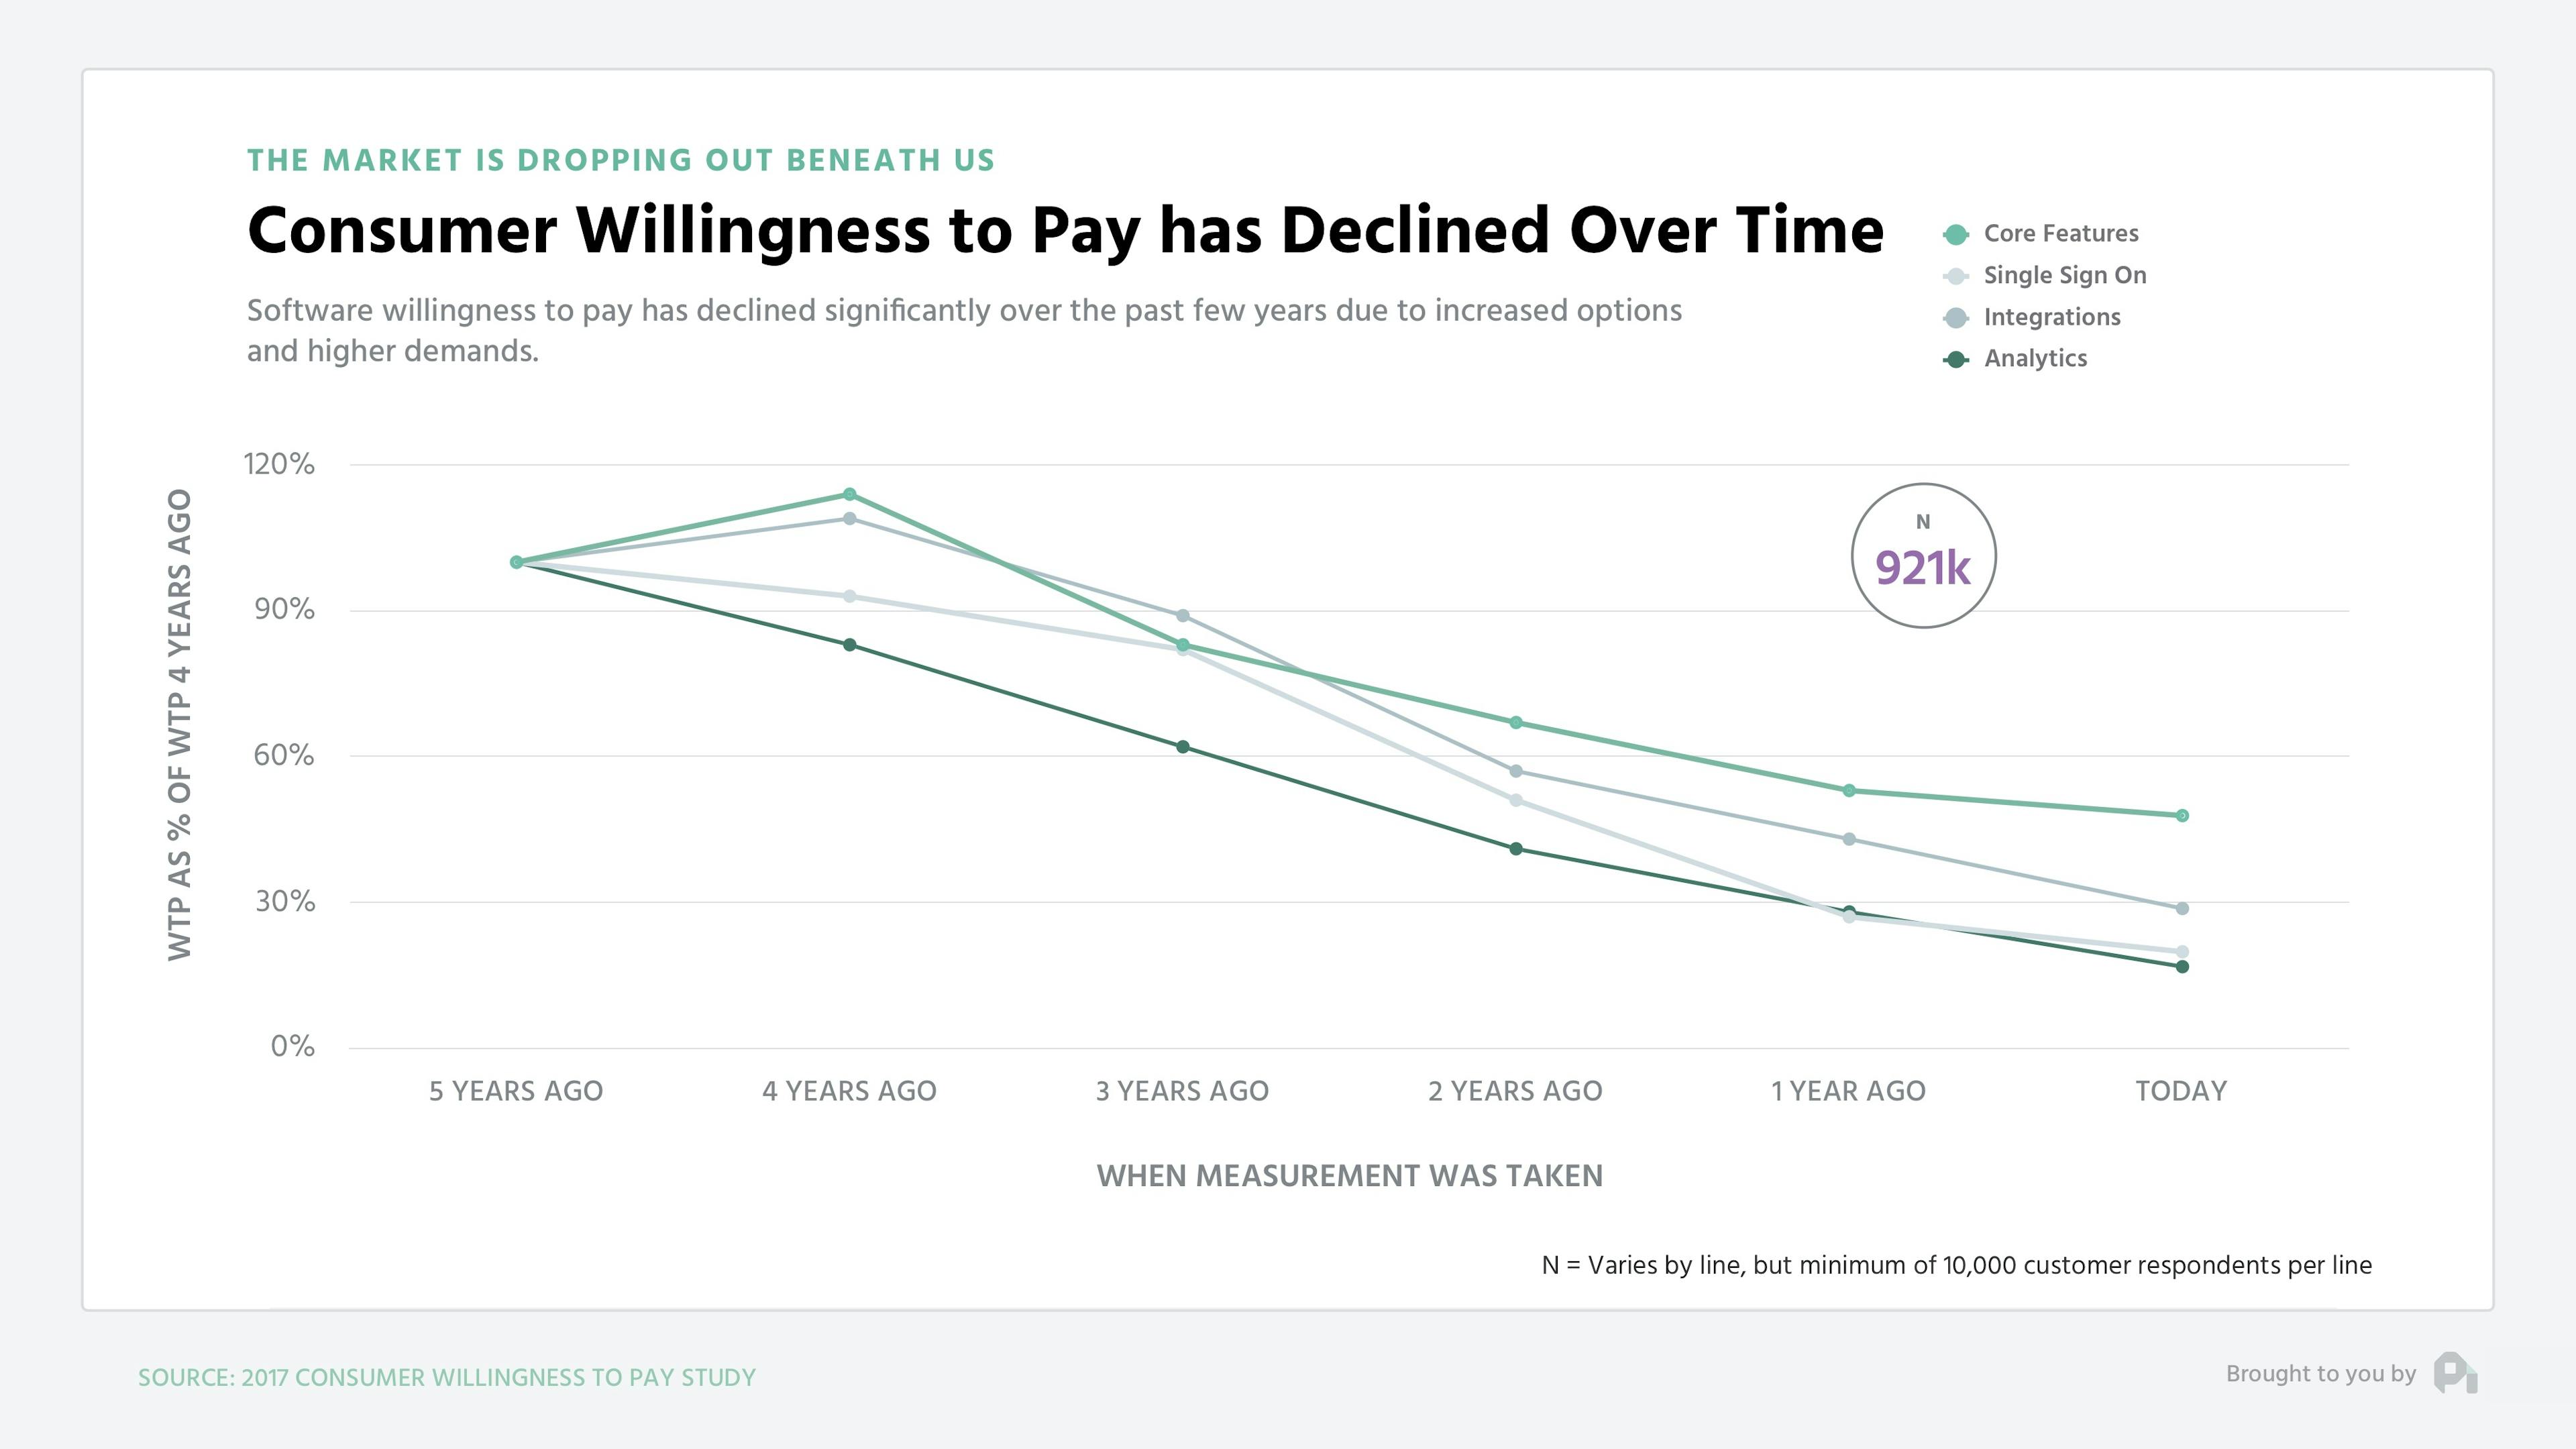
When looking at just over 900,000 customer data points, you’ll notice that products and features have lost 70% of their value over the past five years, meaning that Salesforce integration that you used to sell for $100 per month is now only worth $30 and in a lot of individual cases is probably worth just throwing into the core product.
The loss of value is shocking, but should feel pretty intuitive. After all, the cycles of production and shipping features has increased substantially.
You used to be able to give someone a database with a simple user interface and people thought you were a god. Now if the product doesn’t have good design and great support, it doesn’t matter what your core functionality is because it’s not going to pass as acceptable.
While the value will likely not go truly to zero, the pragmatic question becomes how quickly do products move from a place of value to a place of not being so valuable.
To answer this part, we need to introduce you to a model we’ve been talking about for a bit, but is probably something you haven’t seen before.
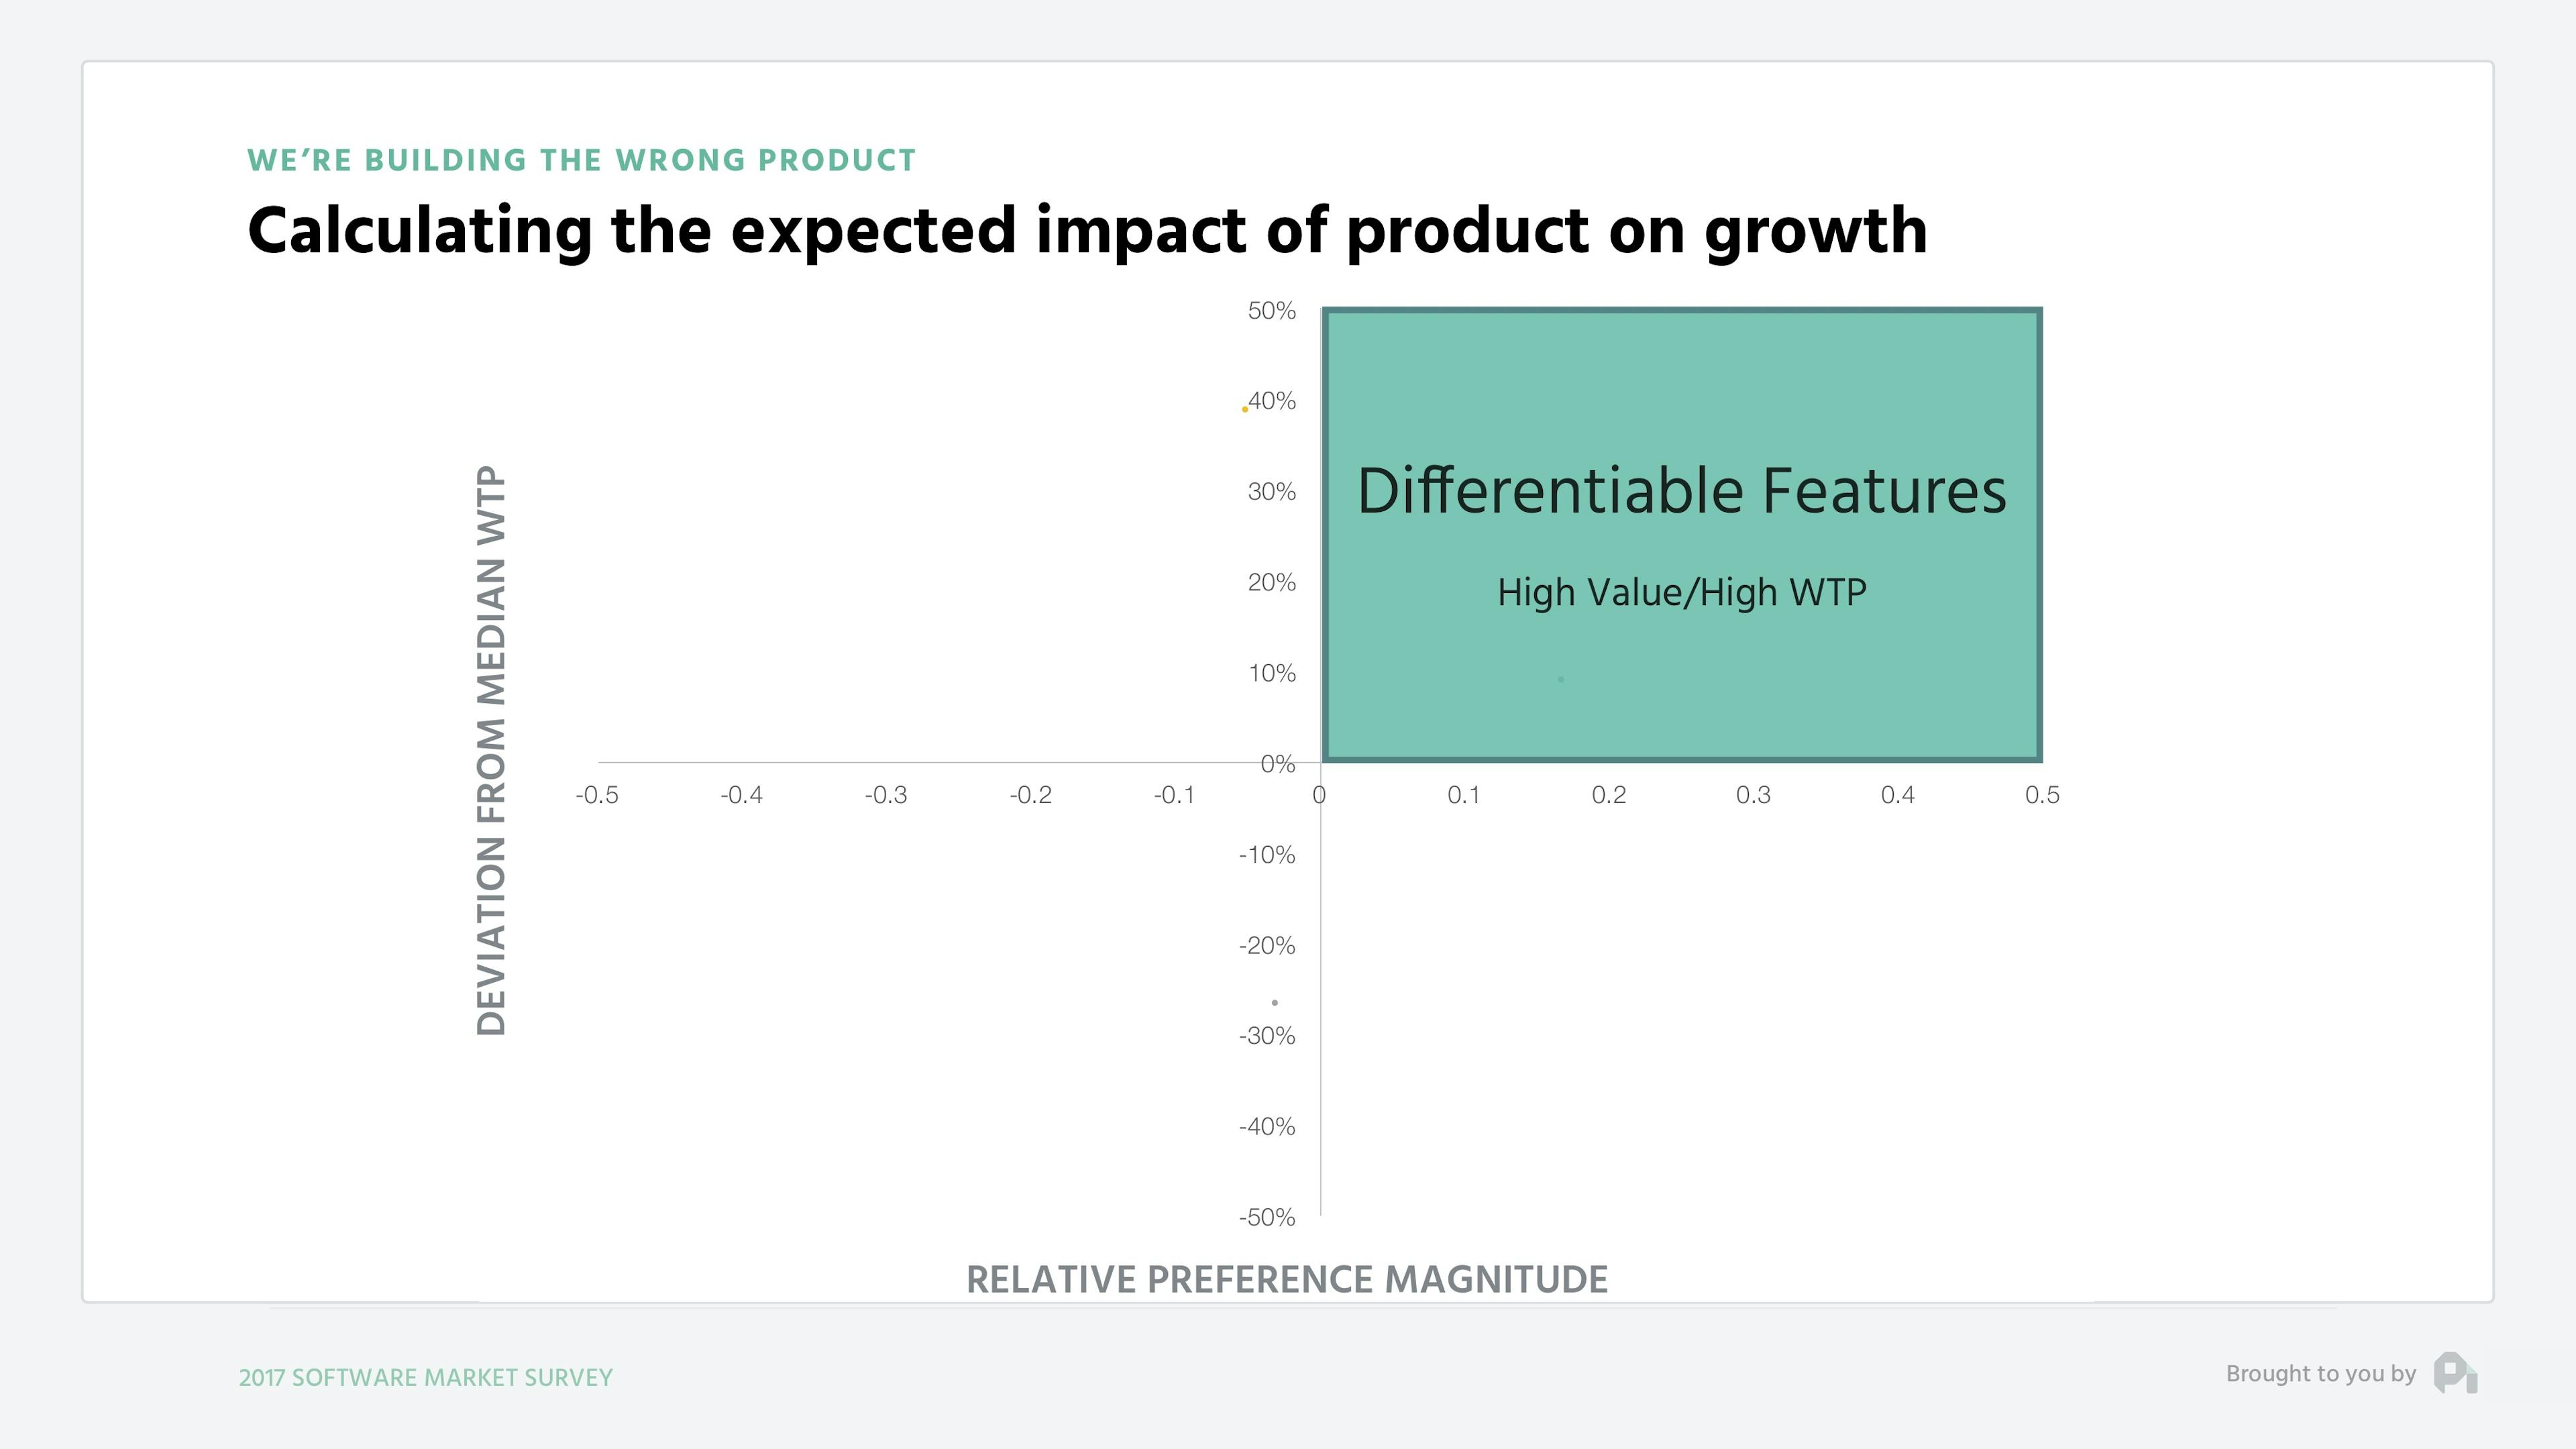
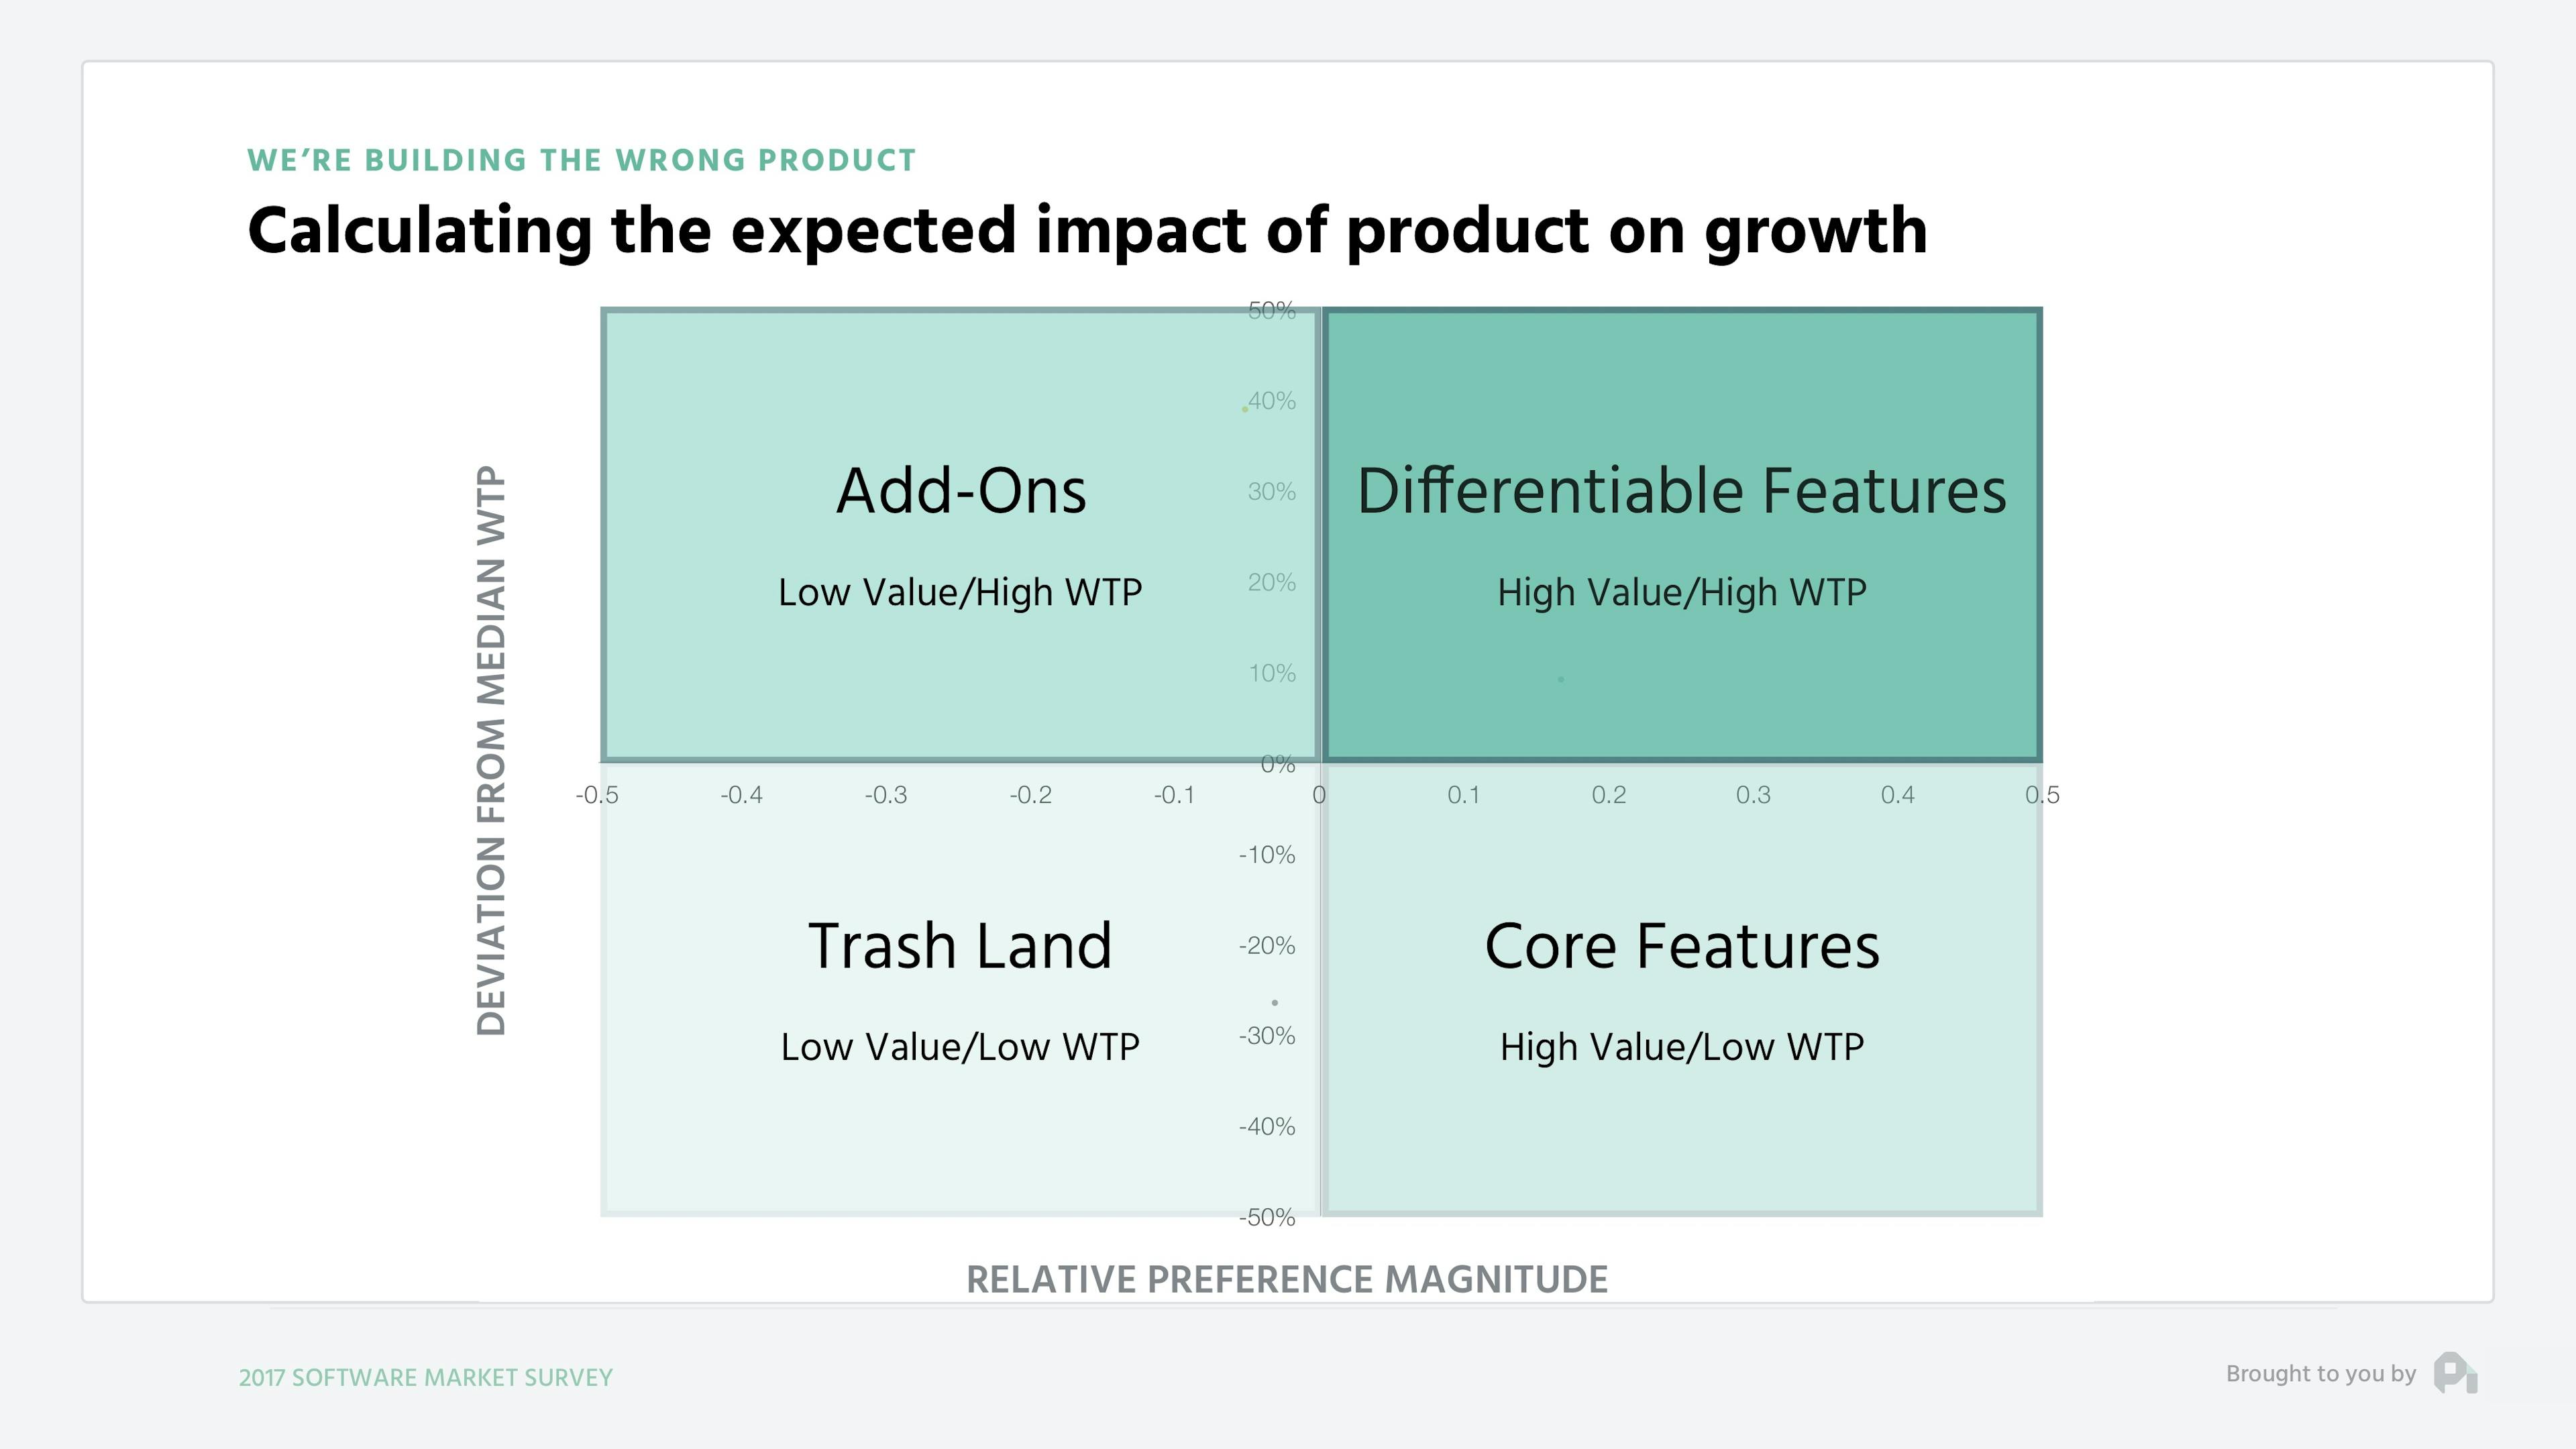
When you’re speaking about value of any product, anything from a cup of coffee to a piece of software, there are two axes of value - the relative value of the features or attributes of that product and then the actual willingness to pay for that product.
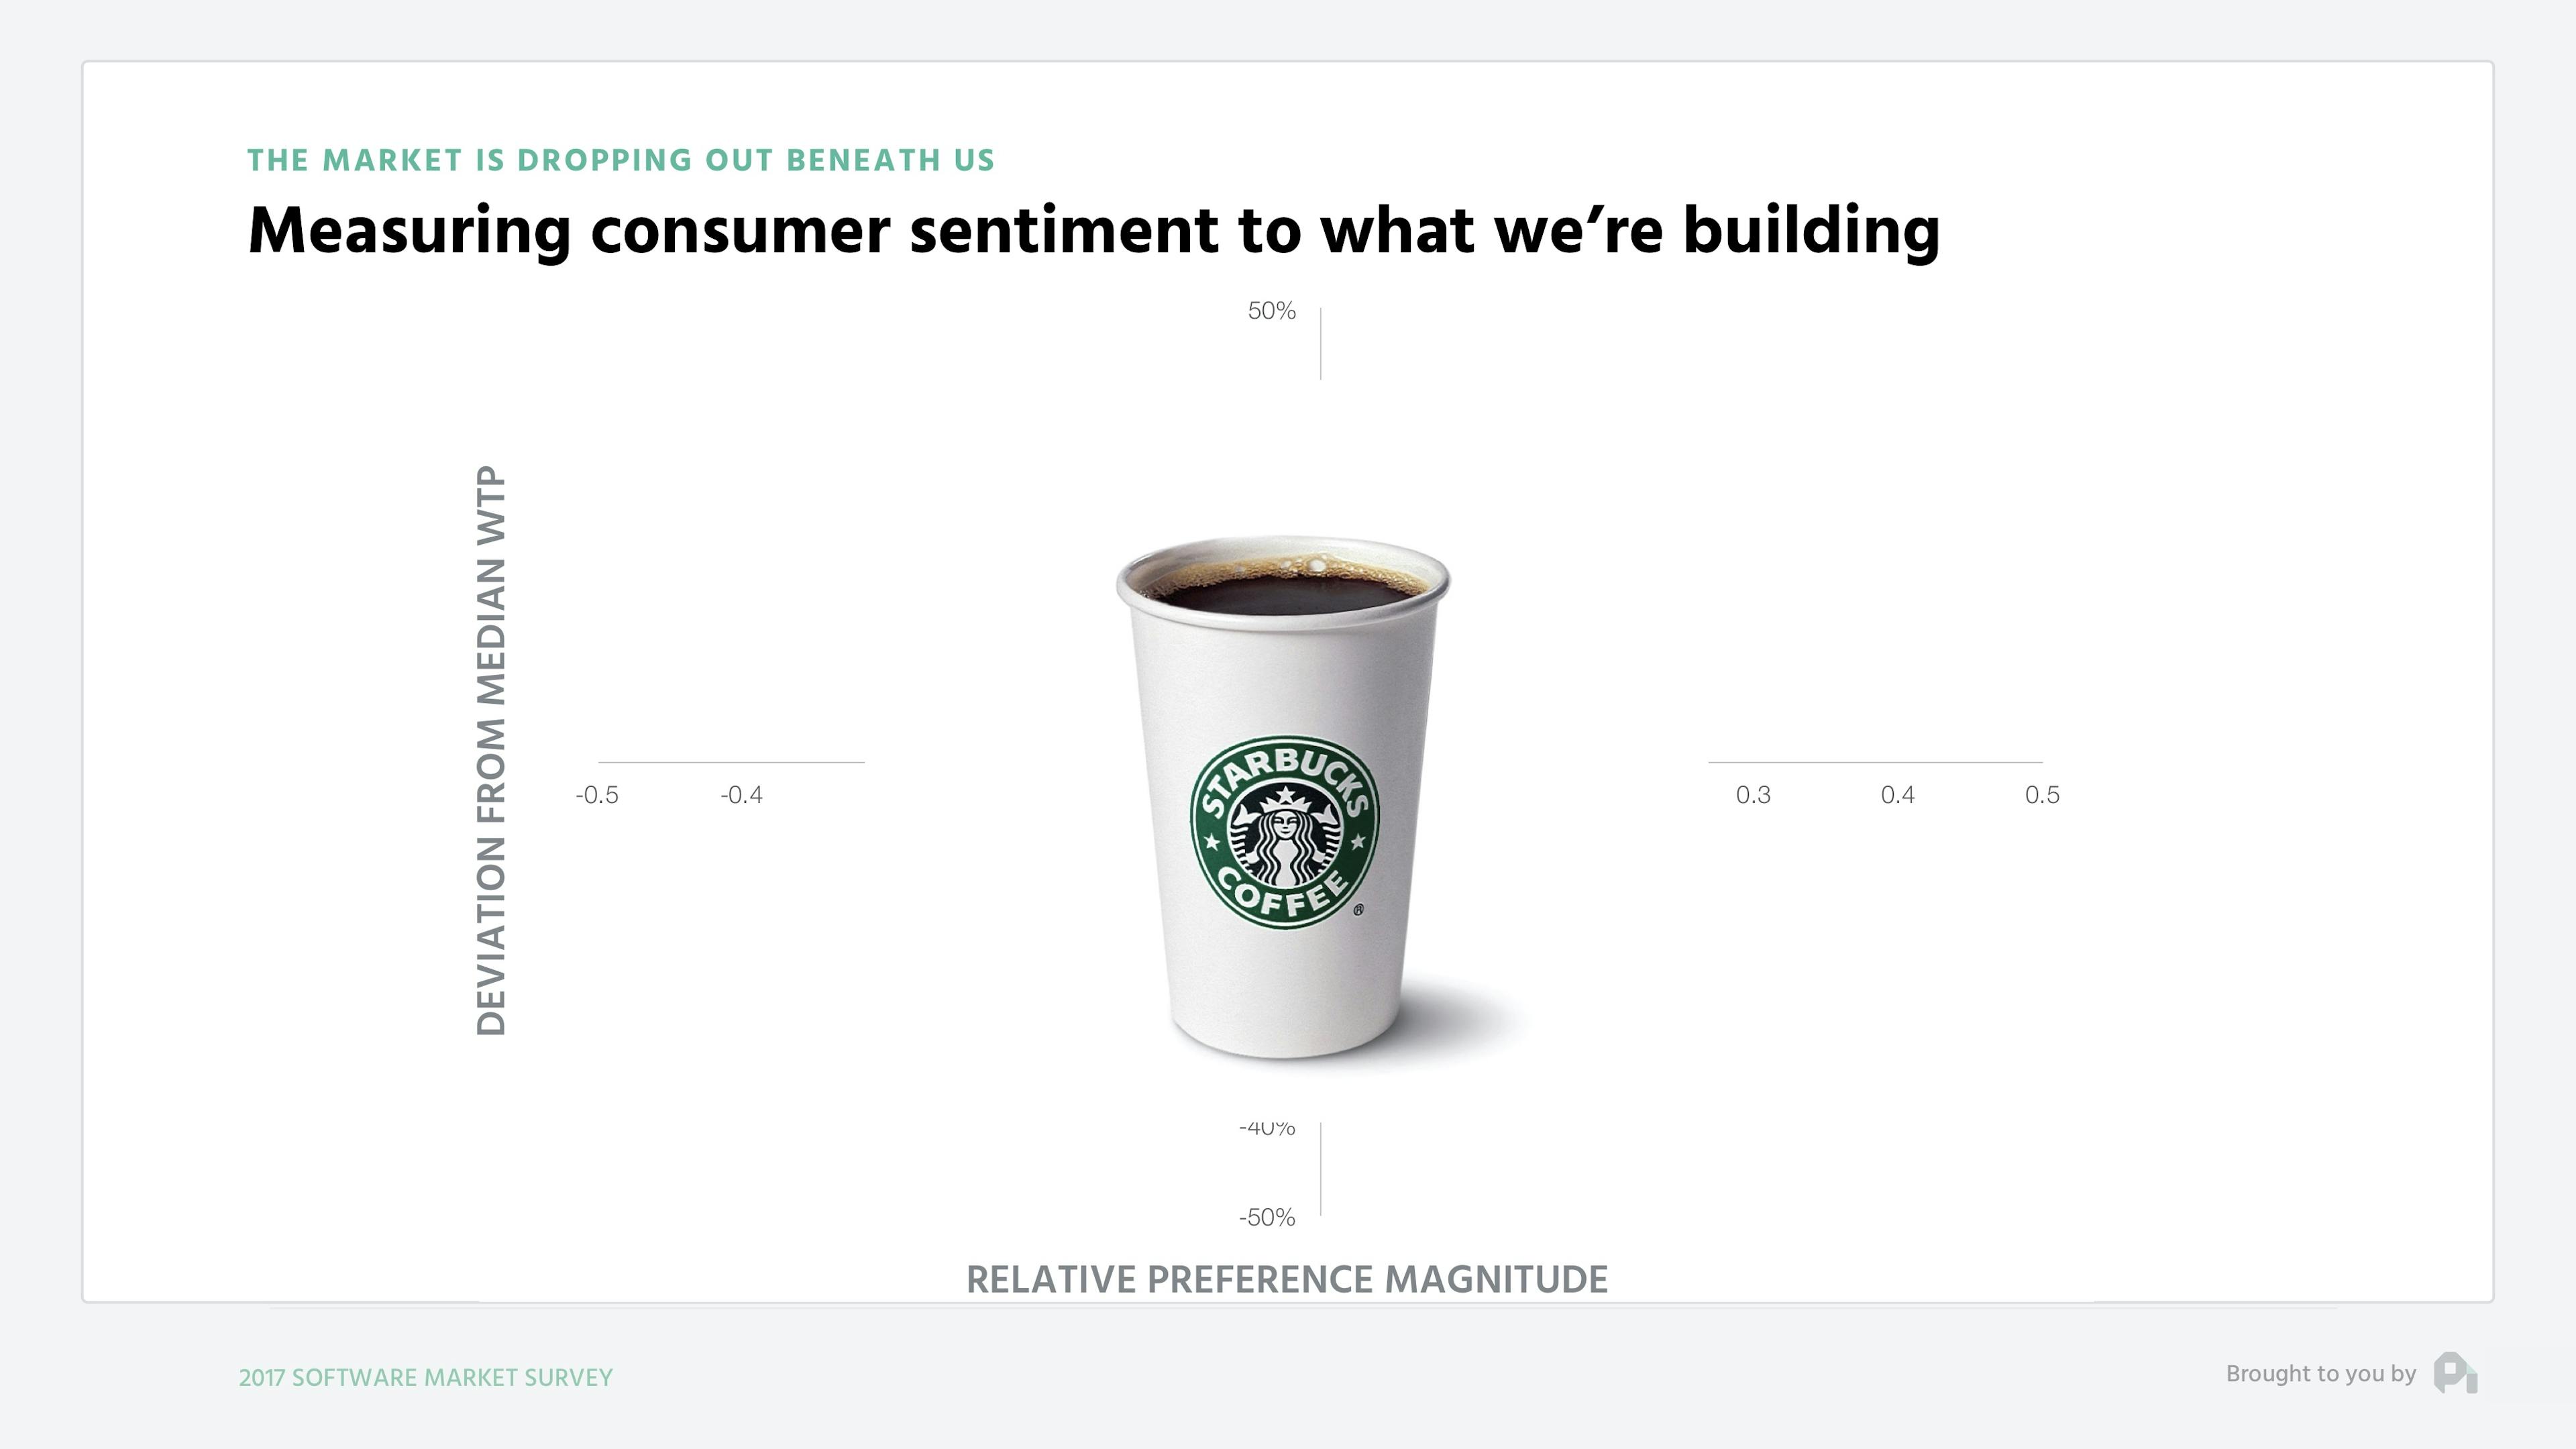
So if we look at a cup of coffee and we survey a large group using some clean statistical methodologies, we likely will find out that something like taste is the most important feature to that group and things like country of origin aren’t important in the aggregate.
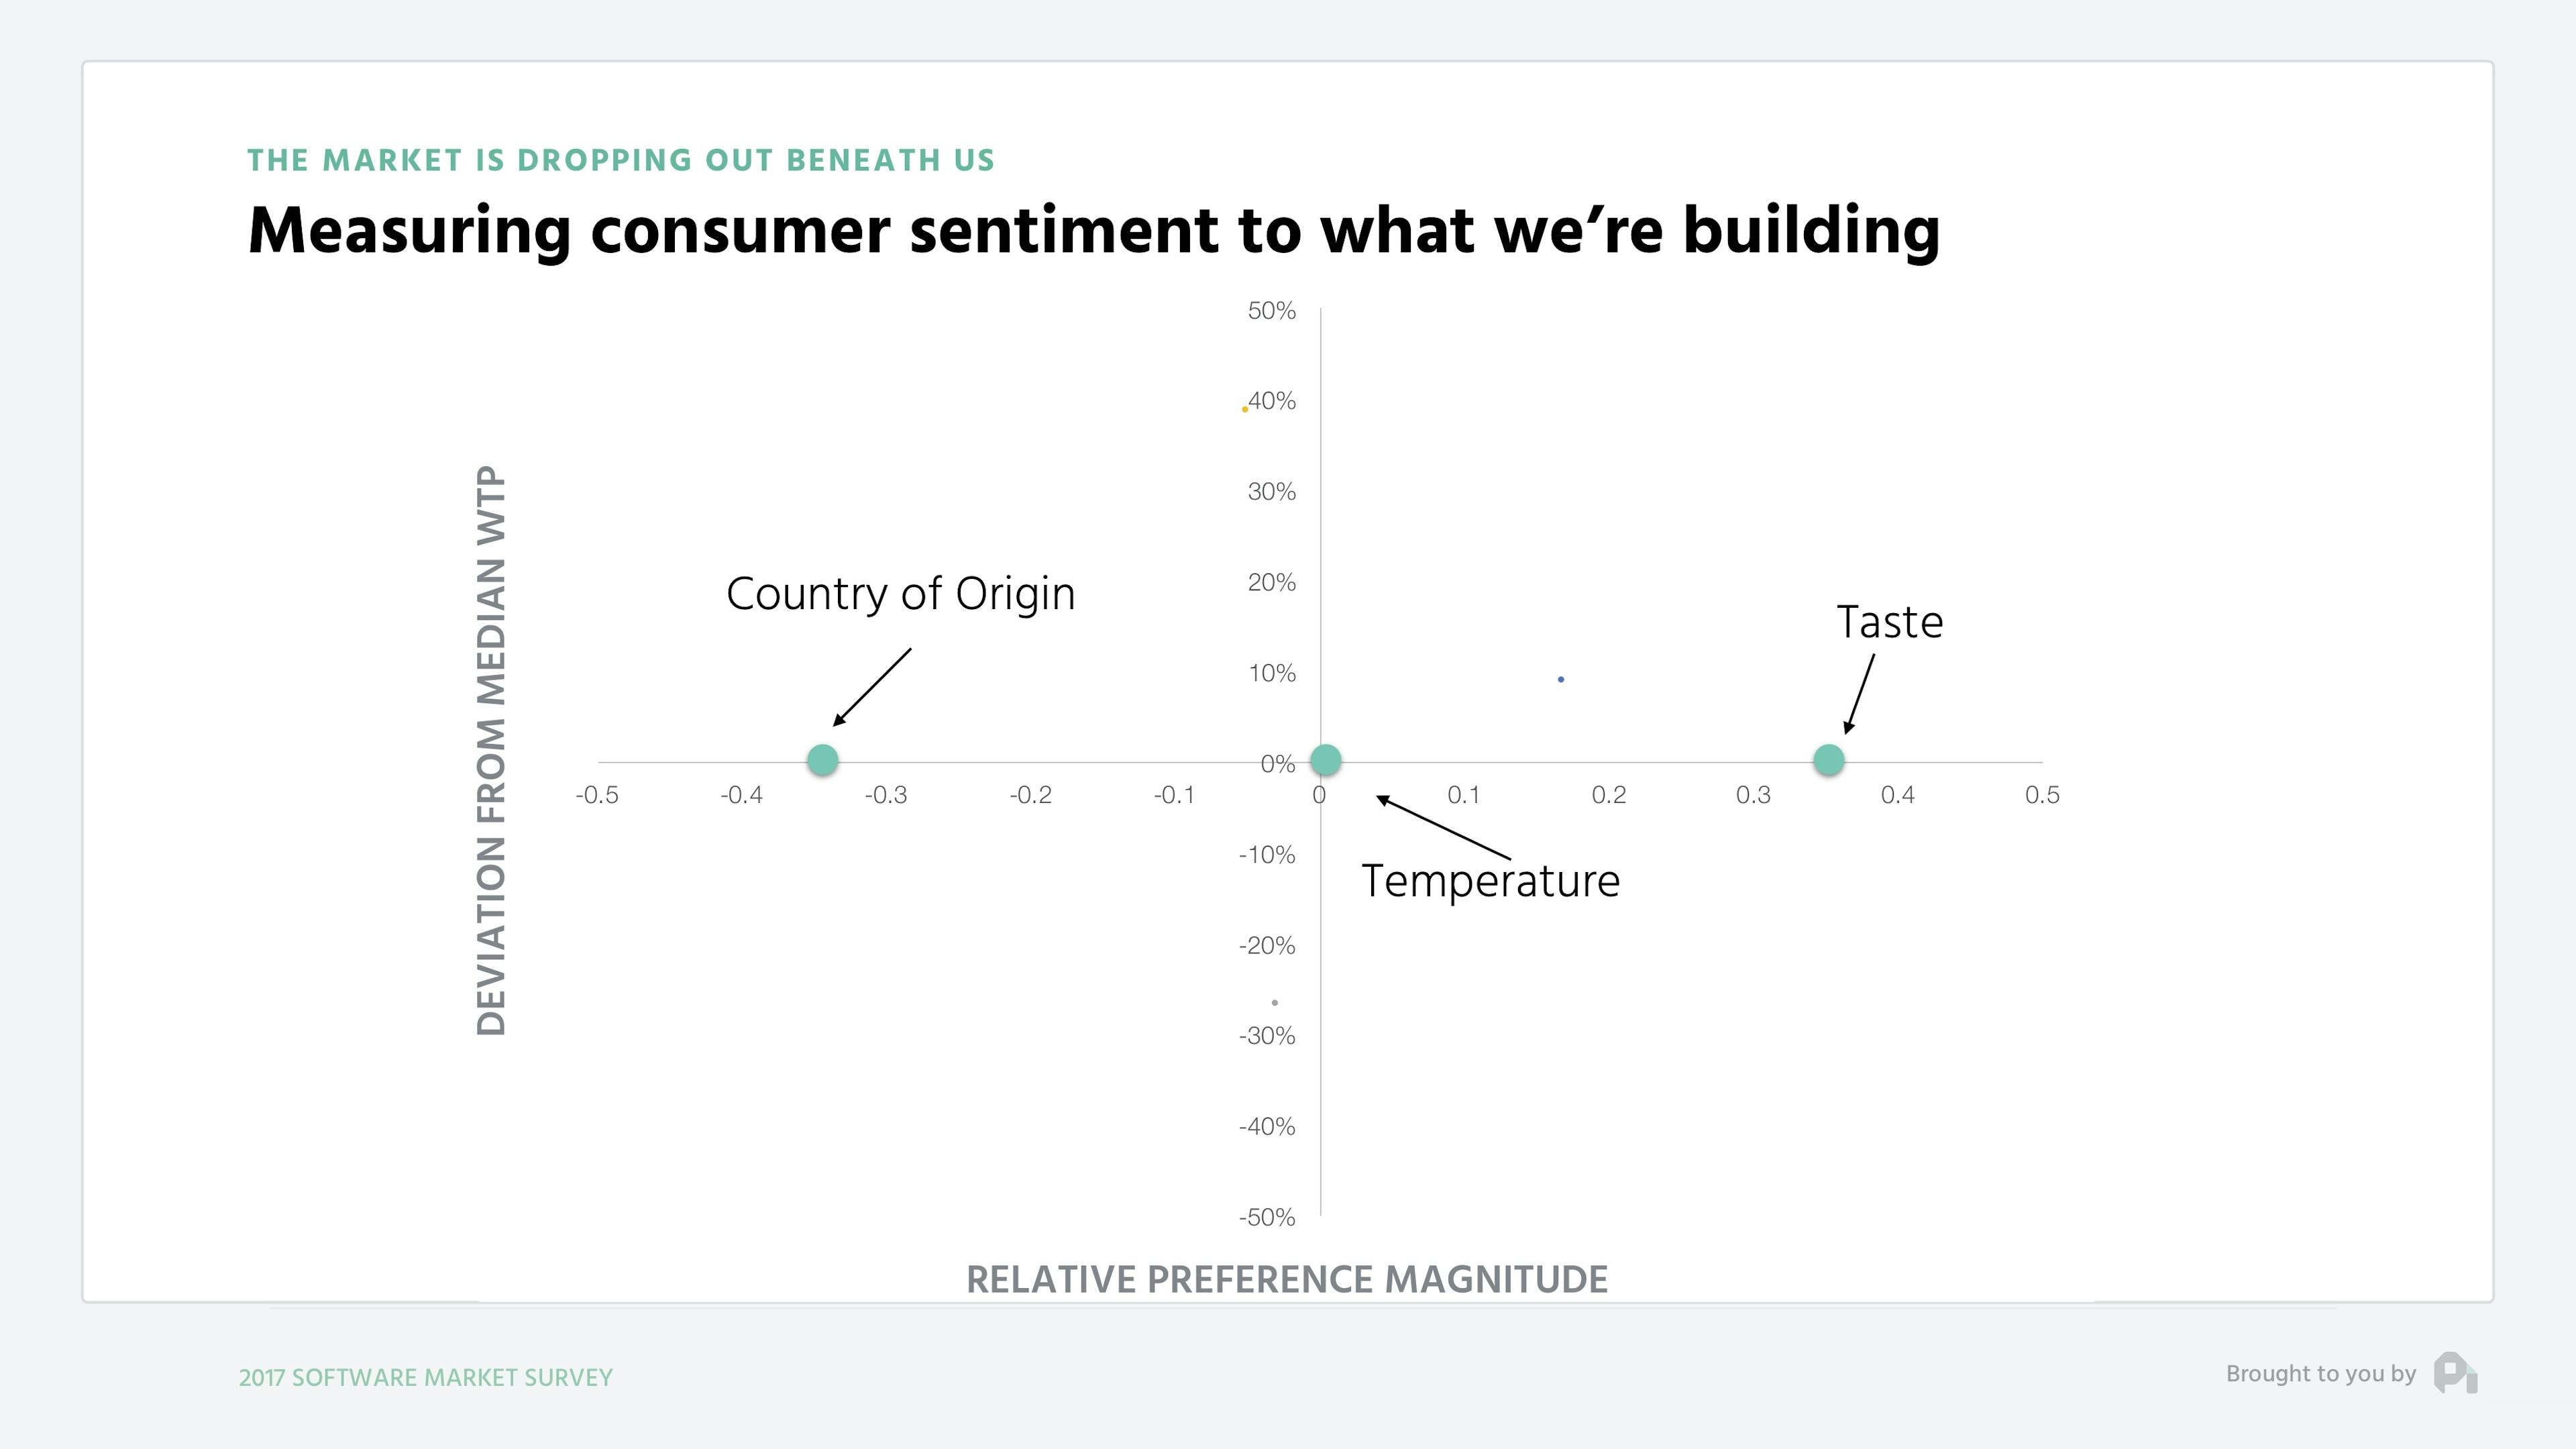
When we layer on the willingness to pay data, we may find that those individuals that care about taste are willing to pay more, those who care about temperature less, and those who care about country of origin, there’s not a lot of them, but they are willing to pay more.
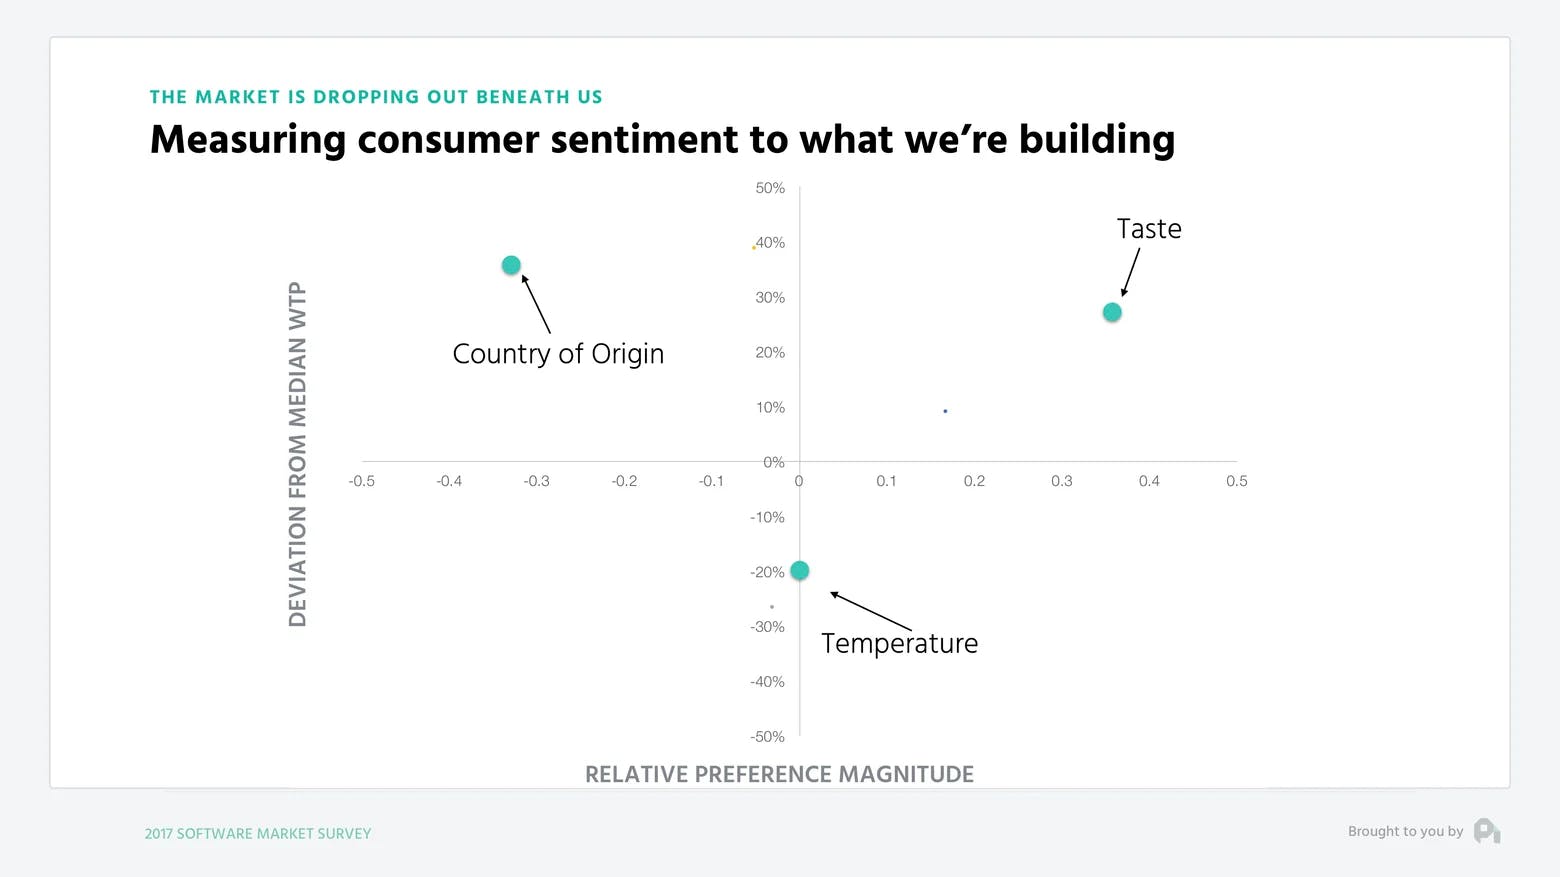
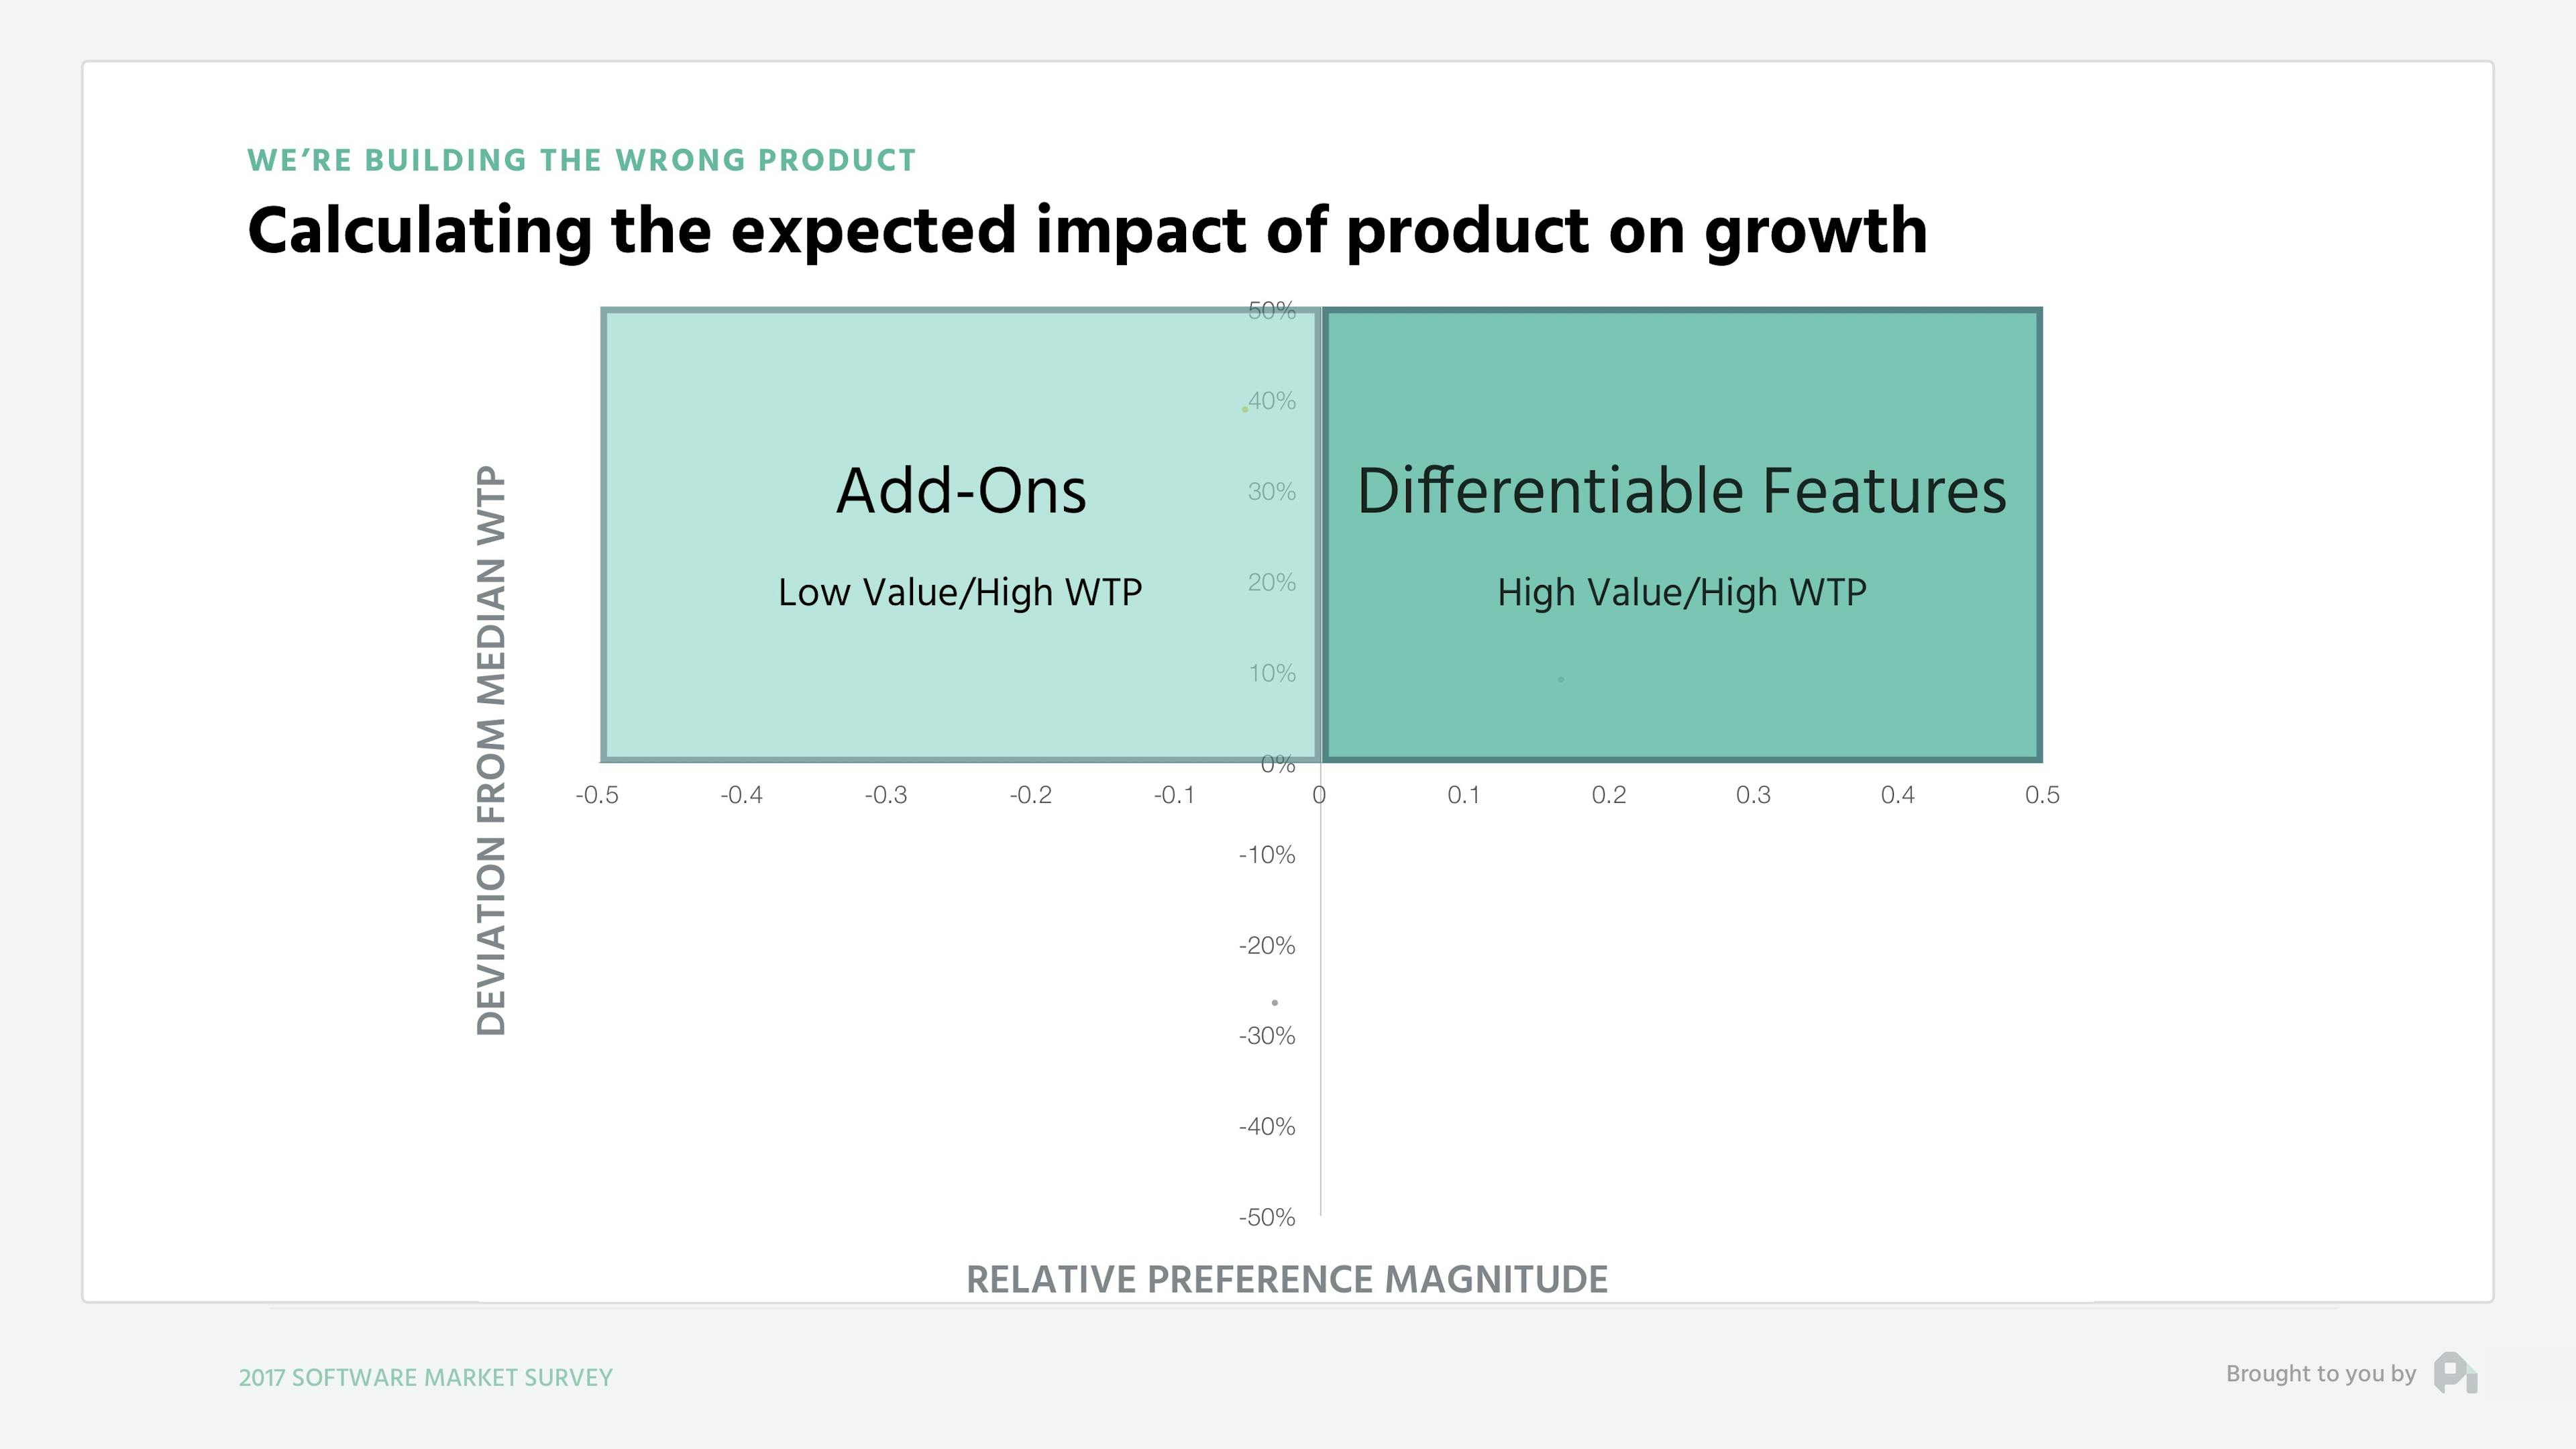
Now if we have a feature where the value relative to other features is high and the willingness to pay of the group that cares about that feature is high, then we have a differentiable feature.
If we find a feature that is low value from a feature perspective, but has high willingness to pay, then we have an add-on.
Something that is high value, but low willingness to pay will be a core feature.
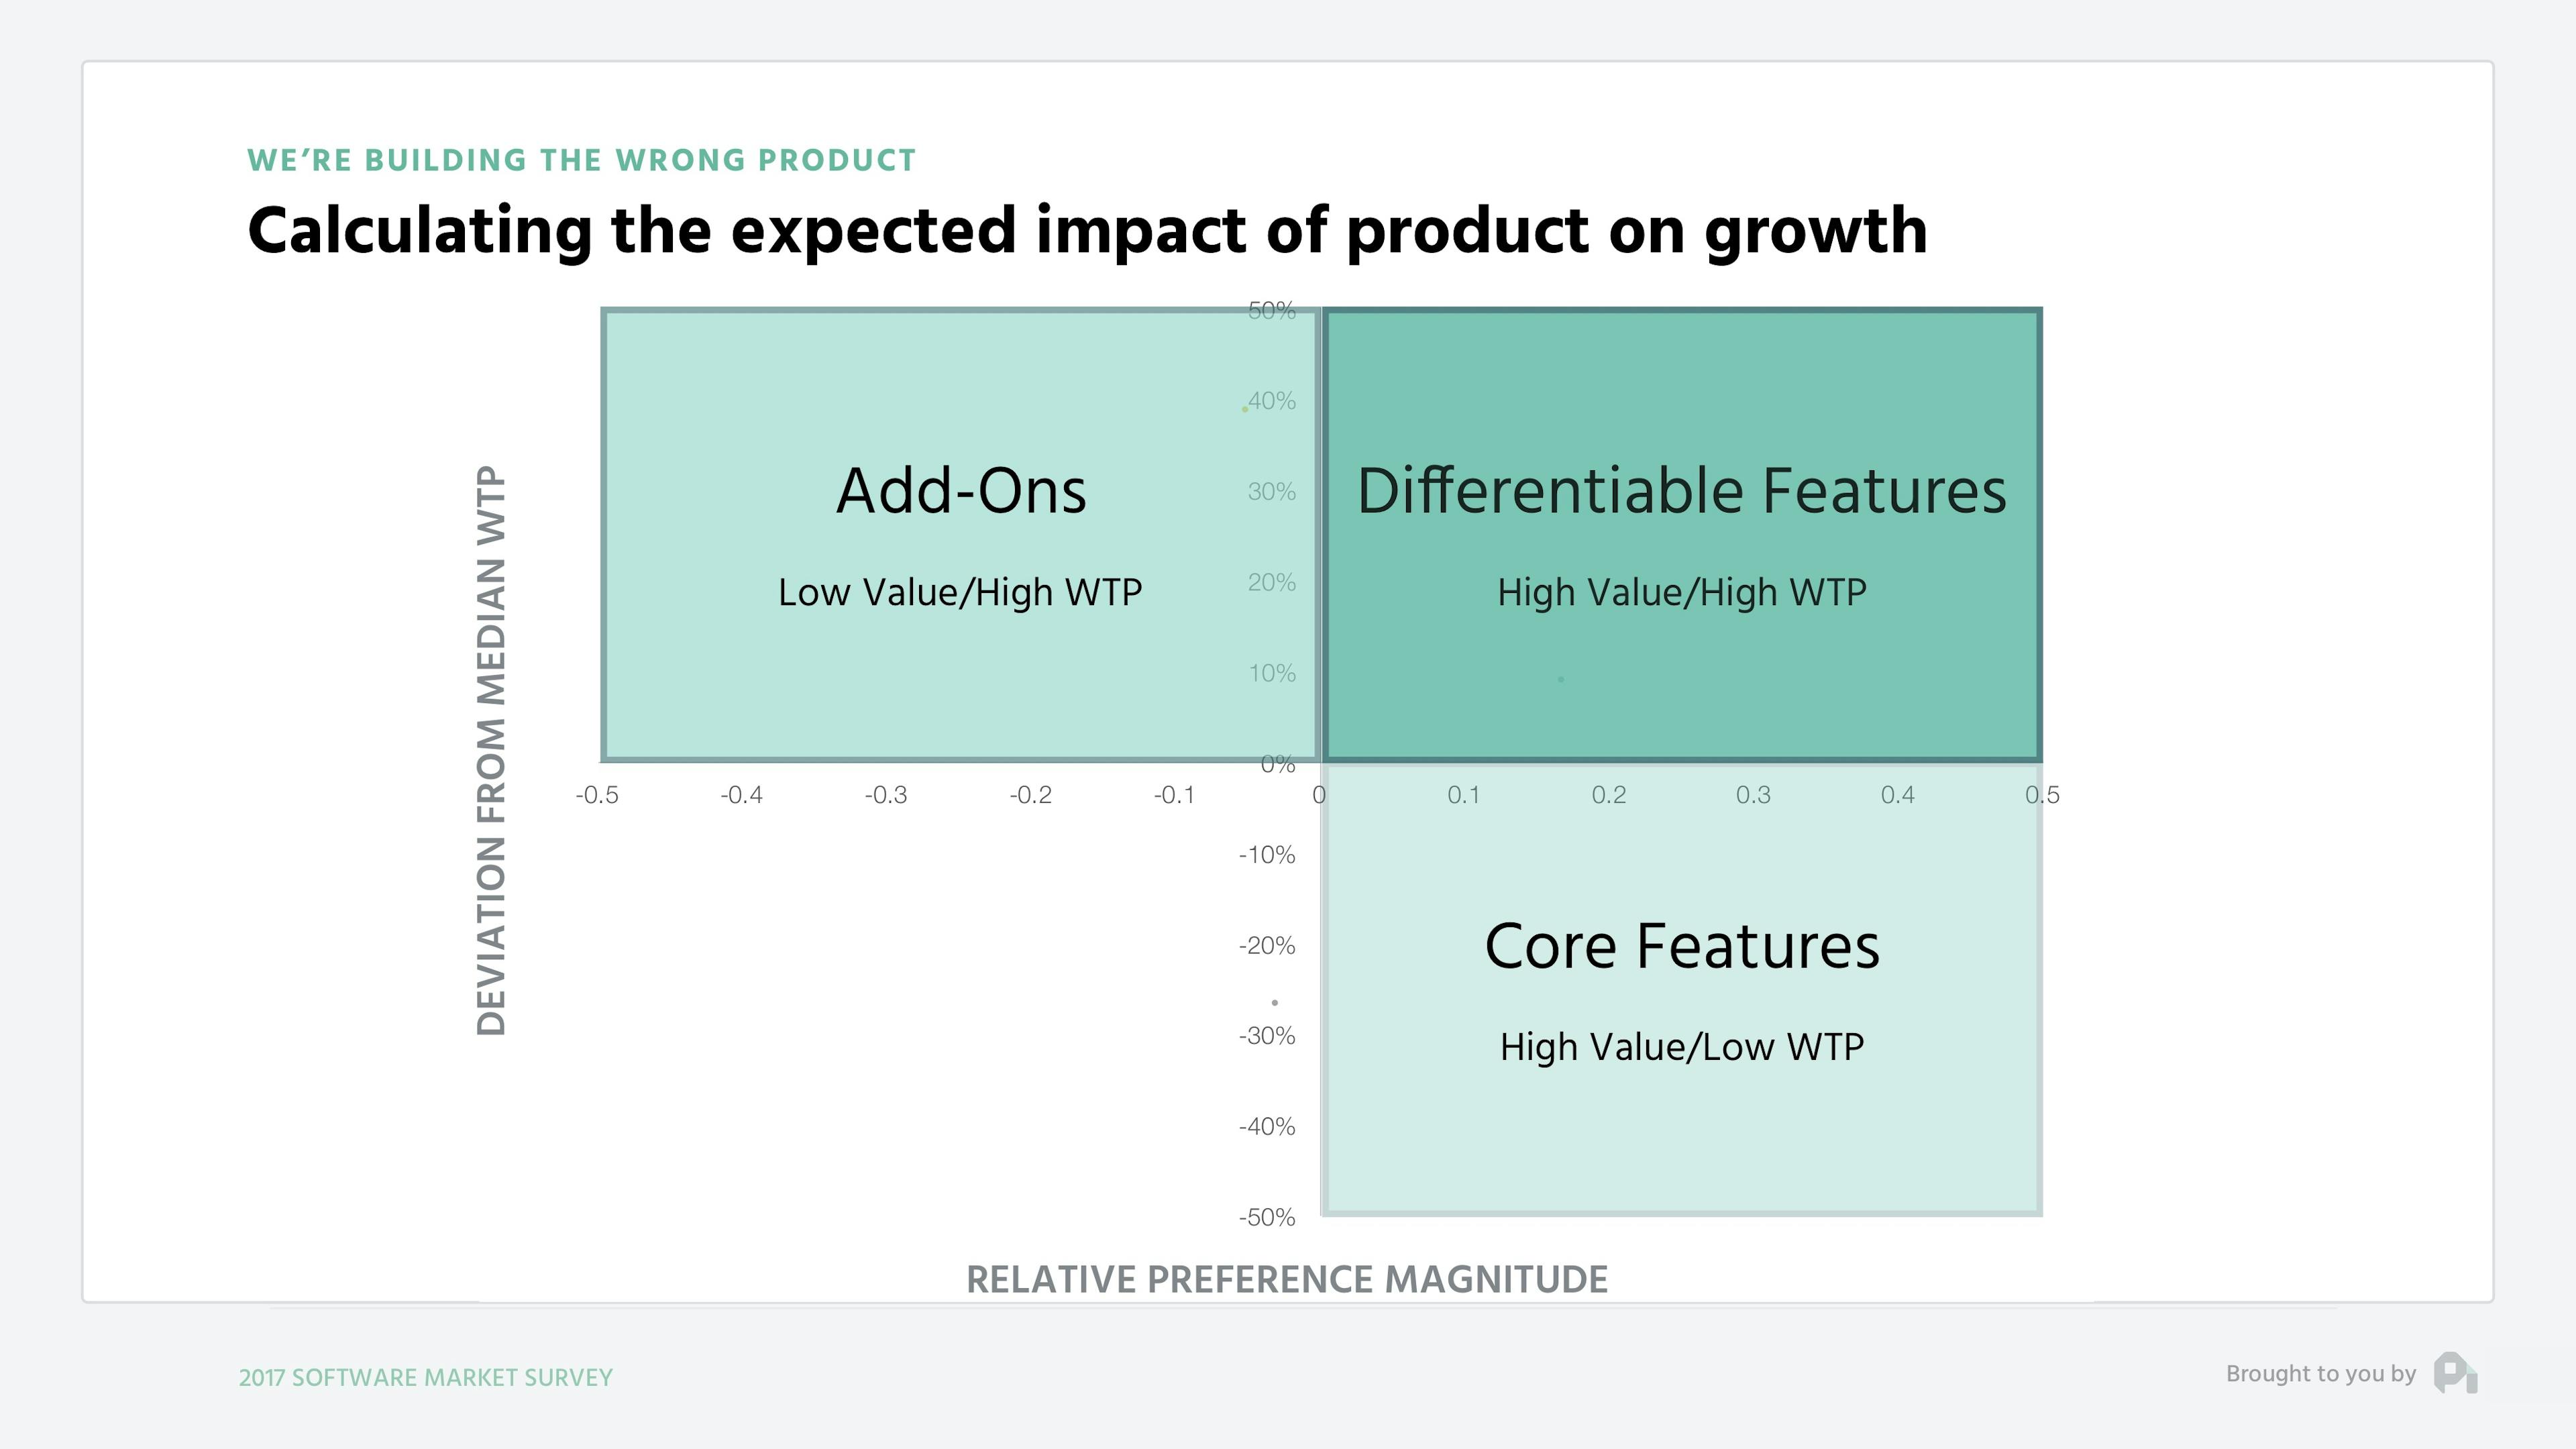
And finally, something low value and low willingness to pay will be trash.
I’m introducing this model, because we’ve been able to study millions of different customers in terms of preferences and further study how features flow from one quadrant to another.
Ten years ago the flow of features looked like this - moving from add-on to differentiable and a bit of core, as well as from differentiable to core.
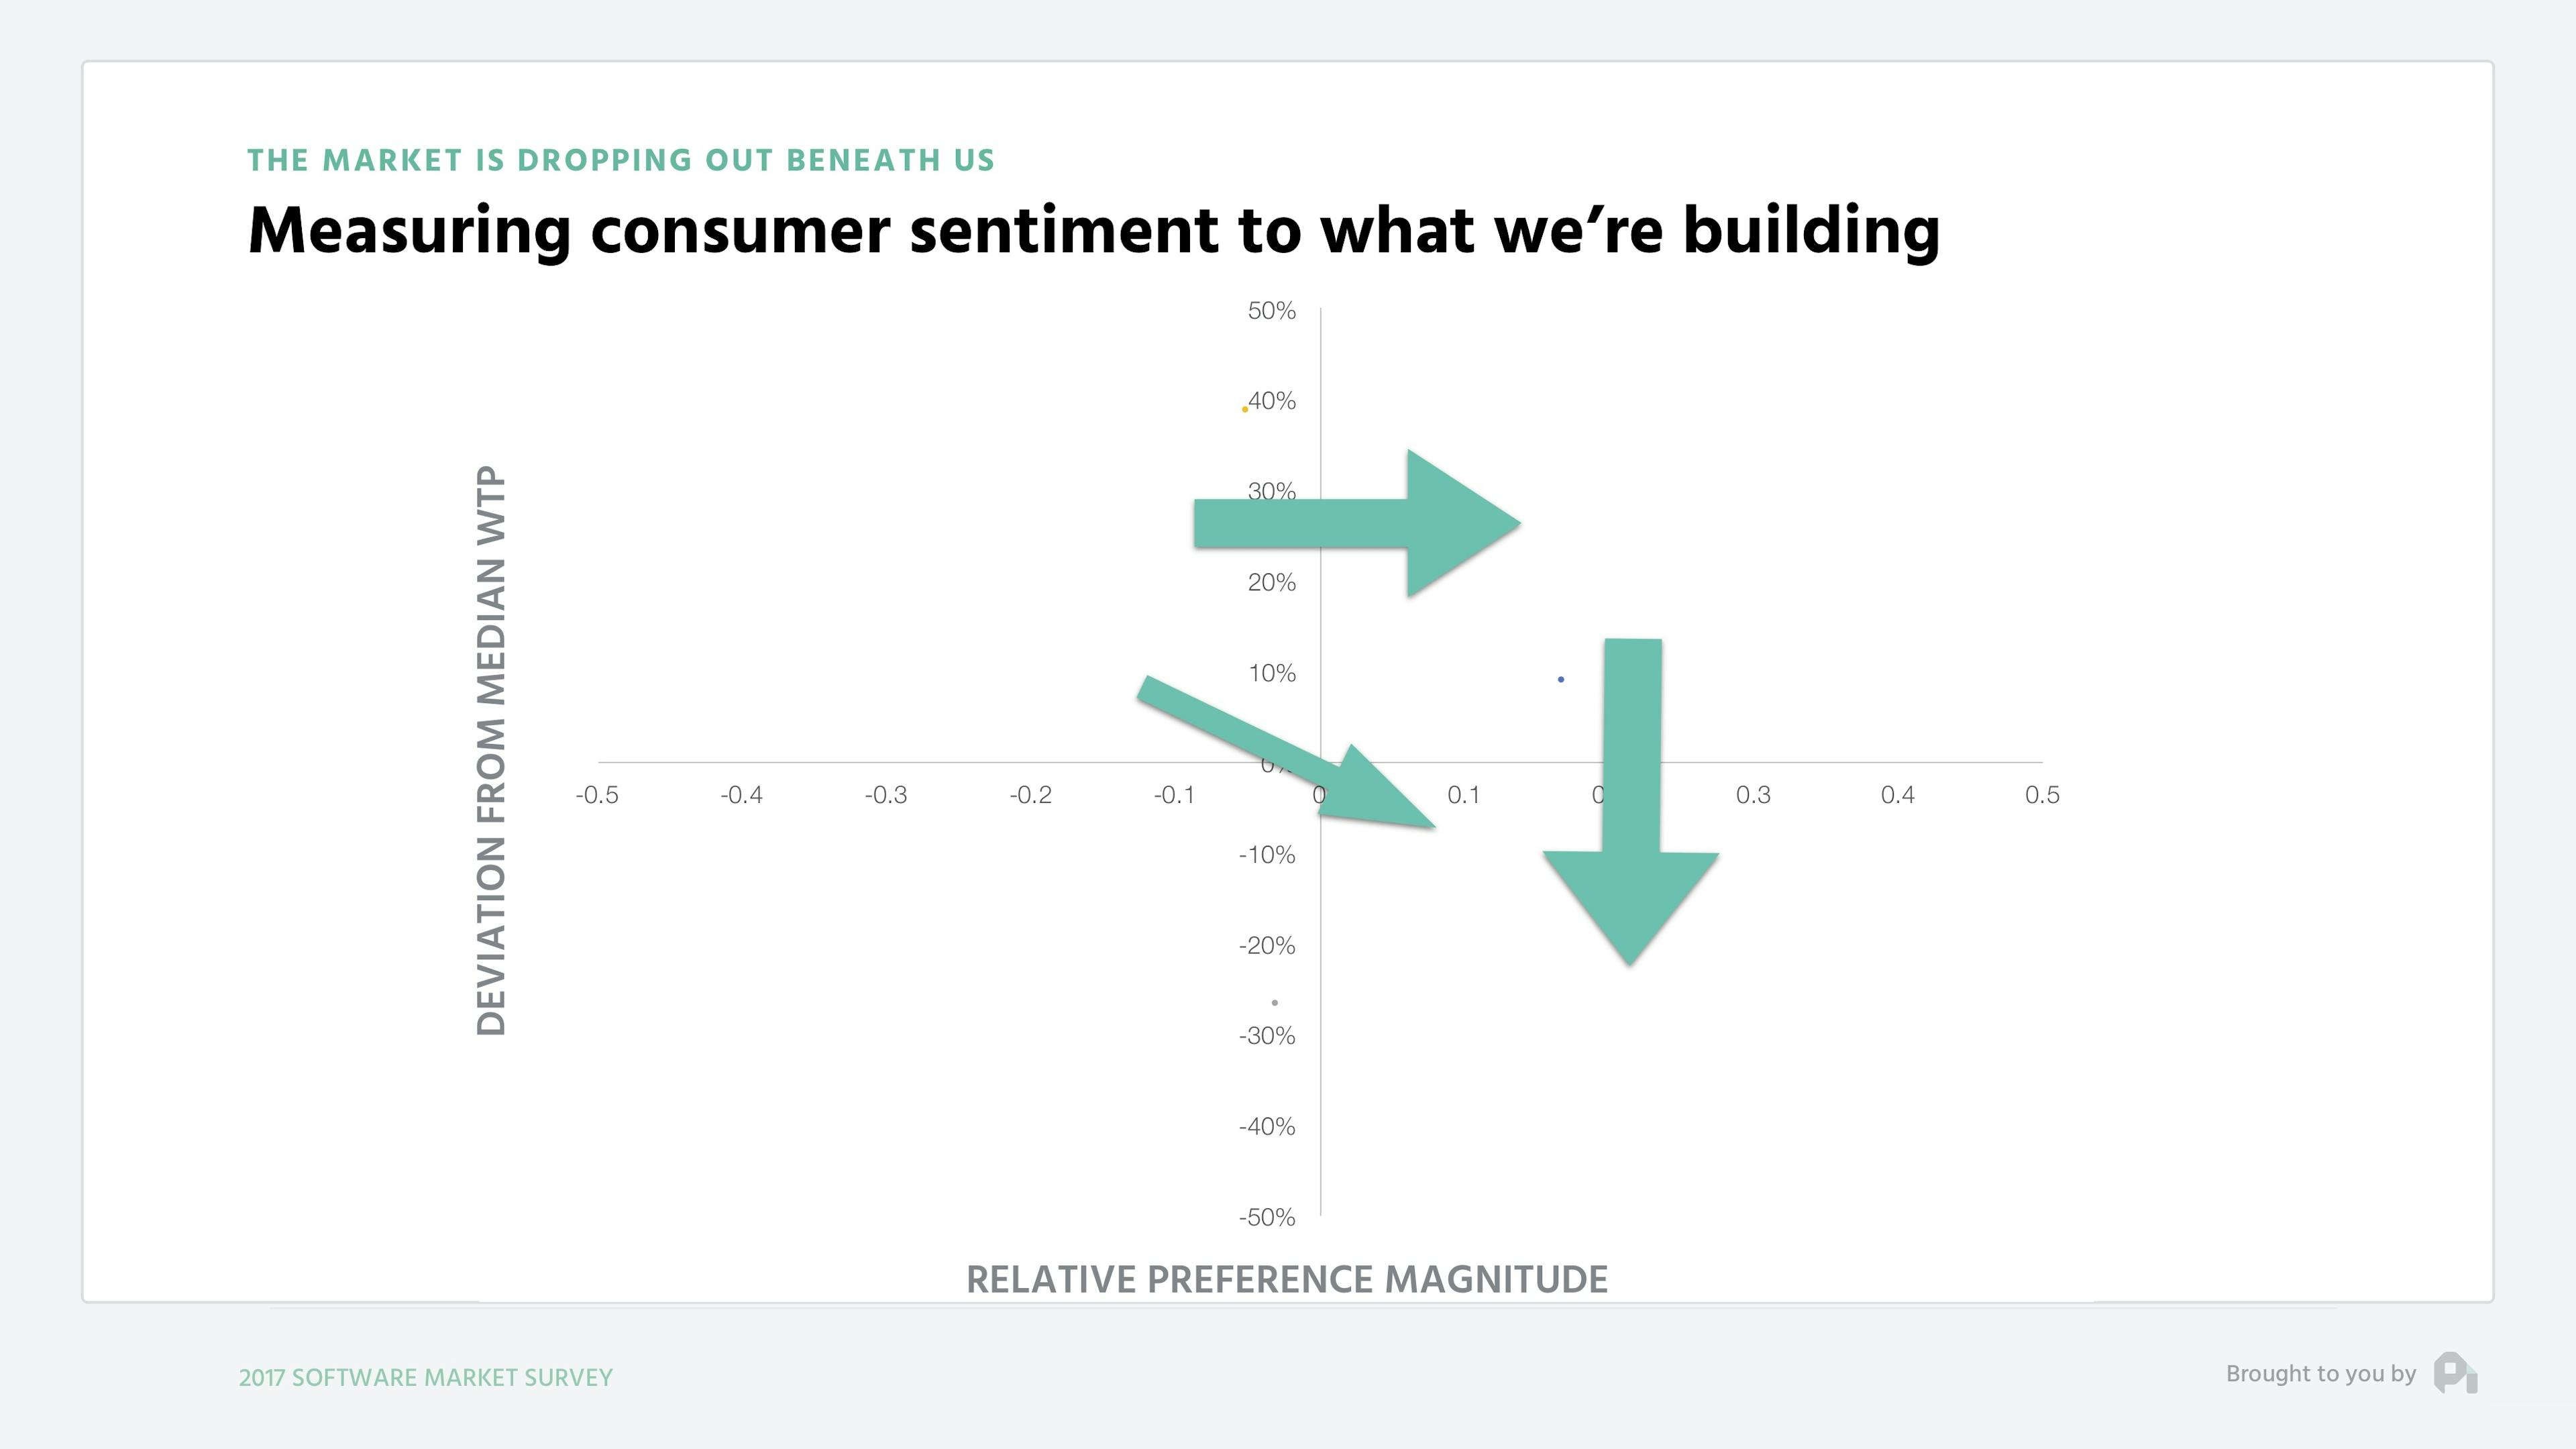
The average time a feature took to move from one quadrant to another was at a pace of 8 to 10 years. Today when measuring that velocity, this is what the movement looks like:
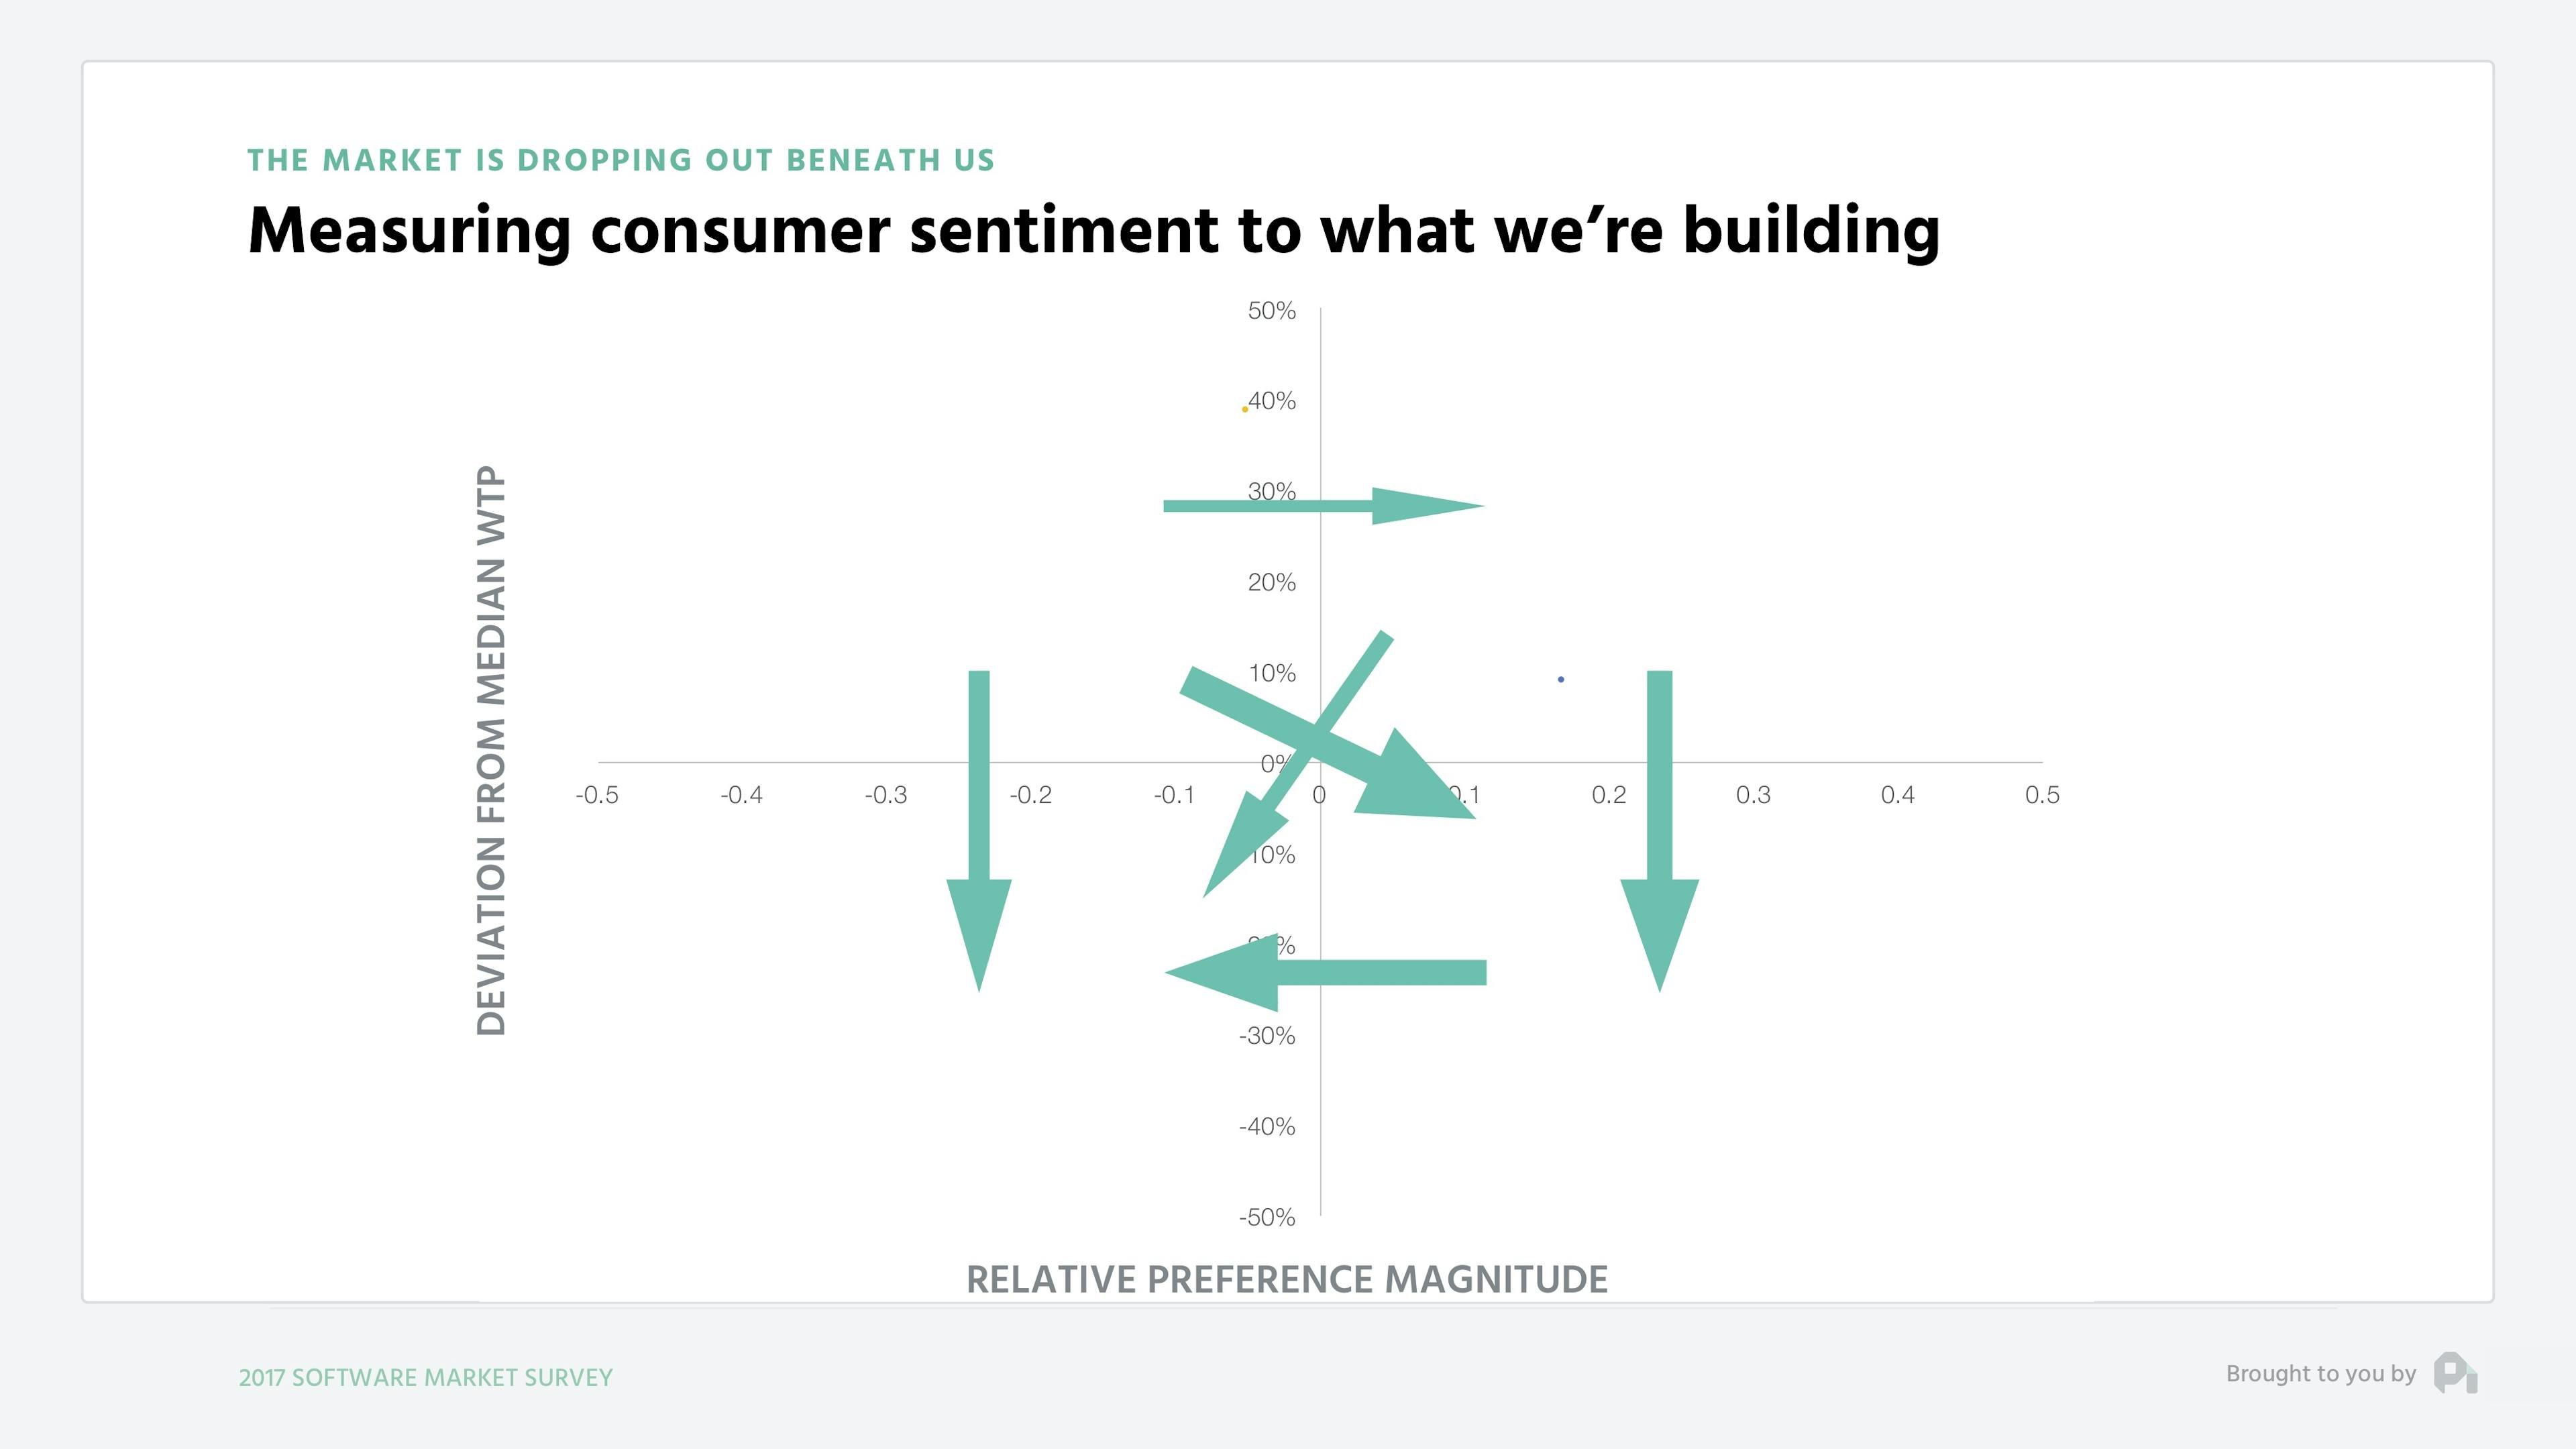
Features are moving quicker and quicker toward not just core, but also not being valuable into the trash quadrant. The average movement time from one quadrant to the next is now as low as 2 years.
To be clear, this isn’t to say that the features you’re building aren’t valuable at all. However, given everything that’s happening in the market, the speed through which features are losing their premium value is extremely troubling given our approach to building product, which is typically devoid of much data or customer research as we’ve seen in previous data studies.
Ultimately, the speed of the market is out of our control with so many companies are out there creating value.
The secret now becomes owning your position in the market and working to find those pockets of value that move slowly between the quadrants, or at the very least getting to a point where you’re measuring the pulse of your customers to understand exactly where you need to optimize your product for customer value, which trickles into retention and growth.
Want to learn more? Check out our recent episode: Is every company destined for freemium? and subscribe to the show to get new episodes.
1
00:00:00,320 --> 00:00:03,520
You've got the questions,
and we have the data.
2
00:00:03,520 --> 00:00:06,620
This is the ProfitWell Report.
3
00:00:08,415 --> 00:00:09,055
Hey, Neil.
4
00:00:09,055 --> 00:00:11,935
This is Ryan Buckley,
the CEO of Mighty Signal.
5
00:00:11,935 --> 00:00:15,595
We've been thinking a lot about
pricing here, and I'm curious.
6
00:00:15,615 --> 00:00:18,720
Is the price of all
software going to zero?
7
00:00:18,720 --> 00:00:22,000
Welcome back, everyone. Neil
here for the ProfitWell Report.
8
00:00:22,000 --> 00:00:24,565
Similar to the price of
computers and memory,
9
00:00:24,565 --> 00:00:27,365
software prices have declined
substantially since the
10
00:00:27,365 --> 00:00:29,365
nineteen eighties and
especially since the nineties
11
00:00:29,365 --> 00:00:33,040
and the early two thousands when
the cloud started to go mainstream.
12
00:00:33,040 --> 00:00:35,840
Costs have come down, buyer
sophistication has increased,
13
00:00:35,840 --> 00:00:39,600
and information has become more
symmetrical between buyers and sellers.
14
00:00:39,600 --> 00:00:41,145
Where's the floor though?
15
00:00:41,145 --> 00:00:44,745
After all, understanding the value
cycles when it comes to features and
16
00:00:44,745 --> 00:00:48,410
functionality is crucial to
ensuring you can defend your price.
17
00:00:48,410 --> 00:00:49,850
So to answer this question,
18
00:00:49,850 --> 00:00:52,730
we looked at over two million
customers and their preferences
19
00:00:52,730 --> 00:00:54,810
around features and
willingness to pay.
20
00:00:54,810 --> 00:00:56,010
Here's what we found.
21
00:00:56,010 --> 00:01:00,015
As to not bear the lead, software
value is certainly declining.
22
00:01:00,015 --> 00:01:03,455
When looking at just over nine
hundred thousand customer data points,
23
00:01:03,455 --> 00:01:05,935
you'll notice that products
and features have lost seventy
24
00:01:05,935 --> 00:01:08,800
percent of their value
over the past five years.
25
00:01:08,800 --> 00:01:11,280
Meaning that the Salesforce
integration that you used to
26
00:01:11,280 --> 00:01:14,385
sell for a hundred dollars per month
is now only worth thirty dollars.
27
00:01:14,385 --> 00:01:17,345
And and a lot of individual
cases probably worth just
28
00:01:17,345 --> 00:01:19,025
throwing into the core product.
29
00:01:19,025 --> 00:01:20,785
The loss of value is shocking,
30
00:01:20,785 --> 00:01:22,705
but should feel
pretty intuitive.
31
00:01:22,705 --> 00:01:24,730
After all, the
cycles of production
32
00:01:28,370 --> 00:01:32,445
database with a simple UI, and
people thought you were a god.
33
00:01:32,445 --> 00:01:35,485
Now if the product doesn't have
good design and great support,
34
00:01:35,485 --> 00:01:38,365
it doesn't really matter what
your core functionality is.
35
00:01:38,365 --> 00:01:40,780
It's not gonna pass as valuable.
36
00:01:40,780 --> 00:01:41,687
To answer this part,
37
00:01:41,687 --> 00:01:42,504
we need to introduce you to a
model we've been talking about
38
00:01:42,504 --> 00:01:44,120
for a while.
39
00:01:50,055 --> 00:01:51,175
To answer this part,
40
00:01:51,175 --> 00:01:54,135
we need to introduce you to a model
we've been talking about for a while,
41
00:01:54,135 --> 00:01:56,855
but it's probably something
you haven't seen before.
42
00:01:56,855 --> 00:01:59,240
When you're speaking about
the value of a product,
43
00:01:59,240 --> 00:02:02,120
anything from a cup of coffee
to a piece of software,
44
00:02:02,120 --> 00:02:04,120
there are two axes of value,
45
00:02:04,120 --> 00:02:06,885
the relative value of the
features or attribute of that
46
00:02:06,885 --> 00:02:10,245
product and then the actual
willingness to pay for that product.
47
00:02:10,245 --> 00:02:12,645
So if we look at a cup of
coffee and we survey a large
48
00:02:12,645 --> 00:02:15,265
group using some clean
statistical methodologies,
49
00:02:15,380 --> 00:02:18,340
we'll likely find out that
something like taste is the
50
00:02:18,340 --> 00:02:20,420
most important
feature to that group,
51
00:02:20,420 --> 00:02:24,505
while things like country of origin
aren't that important in the aggregate.
52
00:02:24,605 --> 00:02:26,925
When we layer on
willingness to pay data,
53
00:02:26,925 --> 00:02:29,245
we may find that those
individuals that care about
54
00:02:29,245 --> 00:02:31,490
taste are willing to pay more,
55
00:02:31,490 --> 00:02:33,970
Those who care about
temperature less and those who
56
00:02:33,970 --> 00:02:36,210
care about country
of origin, well,
57
00:02:36,210 --> 00:02:39,170
there's not a lot of them, but
they are willing to pay more.
58
00:02:39,170 --> 00:02:42,205
Now, if we have a feature where
the value relative to other
59
00:02:42,205 --> 00:02:44,845
features is high and the
willingness to pay for that
60
00:02:44,845 --> 00:02:47,325
group that cares about
that feature is high,
61
00:02:47,325 --> 00:02:49,840
then we have a
differentiable feature.
62
00:02:49,840 --> 00:02:52,240
If you find a feature that
is low value from a feature
63
00:02:52,240 --> 00:02:54,800
perspective but has
high willingness to pay,
64
00:02:54,800 --> 00:02:56,560
then we have an add on.
65
00:02:56,560 --> 00:02:59,125
Something that is high value
but low willingness to pay will
66
00:02:59,125 --> 00:03:00,245
be a core feature,
67
00:03:00,245 --> 00:03:04,325
and then something low value and low
willingness to pay will be trash.
68
00:03:04,325 --> 00:03:06,965
We're introducing this model
because we've been able to
69
00:03:06,965 --> 00:03:09,430
study millions of different
customers in terms of
70
00:03:09,430 --> 00:03:12,630
preferences and further study
how features flow from one
71
00:03:12,630 --> 00:03:14,150
quadrant to another.
72
00:03:14,150 --> 00:03:16,790
Ten years ago, the flow
of features looked like this,
73
00:03:16,790 --> 00:03:19,985
moving from add on to
differentiable and a bit of
74
00:03:19,985 --> 00:03:22,785
core, as well as from
differentiable to core.
75
00:03:22,785 --> 00:03:25,425
The average time a feature took
to move from one quadrant to
76
00:03:25,425 --> 00:03:28,590
another was at a pace
of eight to ten years.
77
00:03:28,590 --> 00:03:31,070
Today, when measuring
that velocity,
78
00:03:31,070 --> 00:03:33,390
this is what the
movement looks like.
79
00:03:33,390 --> 00:03:36,595
Features are moving quicker and
quicker towards not just core,
80
00:03:36,595 --> 00:03:39,955
but also not being valuable
into the trash quadrant.
81
00:03:39,955 --> 00:03:42,835
The average movement time from
one quadrant to the next is now
82
00:03:42,835 --> 00:03:44,770
as low as two years.
83
00:03:44,870 --> 00:03:48,150
To be clear, this isn't to say that
the features you're building aren't
84
00:03:48,150 --> 00:03:49,190
valuable at all.
85
00:03:49,190 --> 00:03:51,745
But given everything that's
happening in the market,
86
00:03:51,745 --> 00:03:53,585
the speed through which
features are losing their
87
00:03:53,585 --> 00:03:56,625
premium value is extremely
troubling given our approach to
88
00:03:56,625 --> 00:03:57,585
building product,
89
00:03:57,585 --> 00:04:00,440
which is typically devoid of
much data or customer research
90
00:04:00,440 --> 00:04:02,680
as we've seen in
previous data studies.
91
00:04:02,680 --> 00:04:06,360
Ultimately, the speed of the market
is out of our control given just how
92
00:04:06,360 --> 00:04:08,845
many companies are out
there creating value.
93
00:04:08,845 --> 00:04:12,205
The secret now becomes owning
your position in the market and
94
00:04:12,205 --> 00:04:14,765
working to find those pockets
of value that move slowly
95
00:04:14,765 --> 00:04:18,130
between the quadrants or at the
very least getting to a point
96
00:04:18,130 --> 00:04:20,610
where you're measuring the
pulse of your customers to
97
00:04:20,610 --> 00:04:23,170
understand exactly where you
need to optimize your product
98
00:04:23,170 --> 00:04:25,295
for customer value,
which, you know,
99
00:04:25,295 --> 00:04:27,455
trickles into
retention and growth.
100
00:04:27,455 --> 00:04:29,215
Well, that's all for now.
101
00:04:29,215 --> 00:04:30,175
If you have a question,
102
00:04:30,175 --> 00:04:32,975
feel free to send me an email
or video anytime to neil at
103
00:04:32,975 --> 00:04:34,255
profit well dot com.
104
00:04:34,255 --> 00:04:37,280
And And if you get value from
today's episode or any others,
105
00:04:37,280 --> 00:04:40,080
we appreciate any and all
shares on Twitter and LinkedIn
106
00:04:40,080 --> 00:04:41,955
because that's how we
know to keep going.
107
00:04:41,955 --> 00:04:43,935
I will see you next week.
108
00:04:45,795 --> 00:04:48,354
This week's episode is
brought to you by binder,
109
00:04:48,354 --> 00:04:51,154
giving your brand the
organization it needs and your
110
00:04:51,154 --> 00:04:53,474
organization the
brand it deserves.
111
00:04:53,474 --> 00:04:55,294
Binder dot com.