Which Tactics Will Increase Willingness to Pay?
This episode might reference ProfitWell and ProfitWell Recur, which following the acquisition by Paddle is now Paddle Studios. Some information may be out of date.
Originally published: July 9th, 2019
To answer this question, we looked at the data from just over one million different subscription consumers and just under two thousand companies. Here’s what we found.
Your price is the exchange rate on the value you’re providing. A phenomenal aspect of the subscription and SaaS economy is that we now have the ability to build features and other value adding functionality into our products extremely quickly.
Yet, understanding what your customers or target customers value and making sure you’re using data to get to persona-pricing fit can take quite some time, as it’s an ongoing process of continual price optimization. We all know that, especially if you’ve read almost anything we’ve published.
To answer this question, we looked at the data from just over one million different subscription consumers and just under two thousand companies. Here’s what we found.
But first, if you like this kind of content and want to learn more, subscribe to get in the know when we release new episodes.

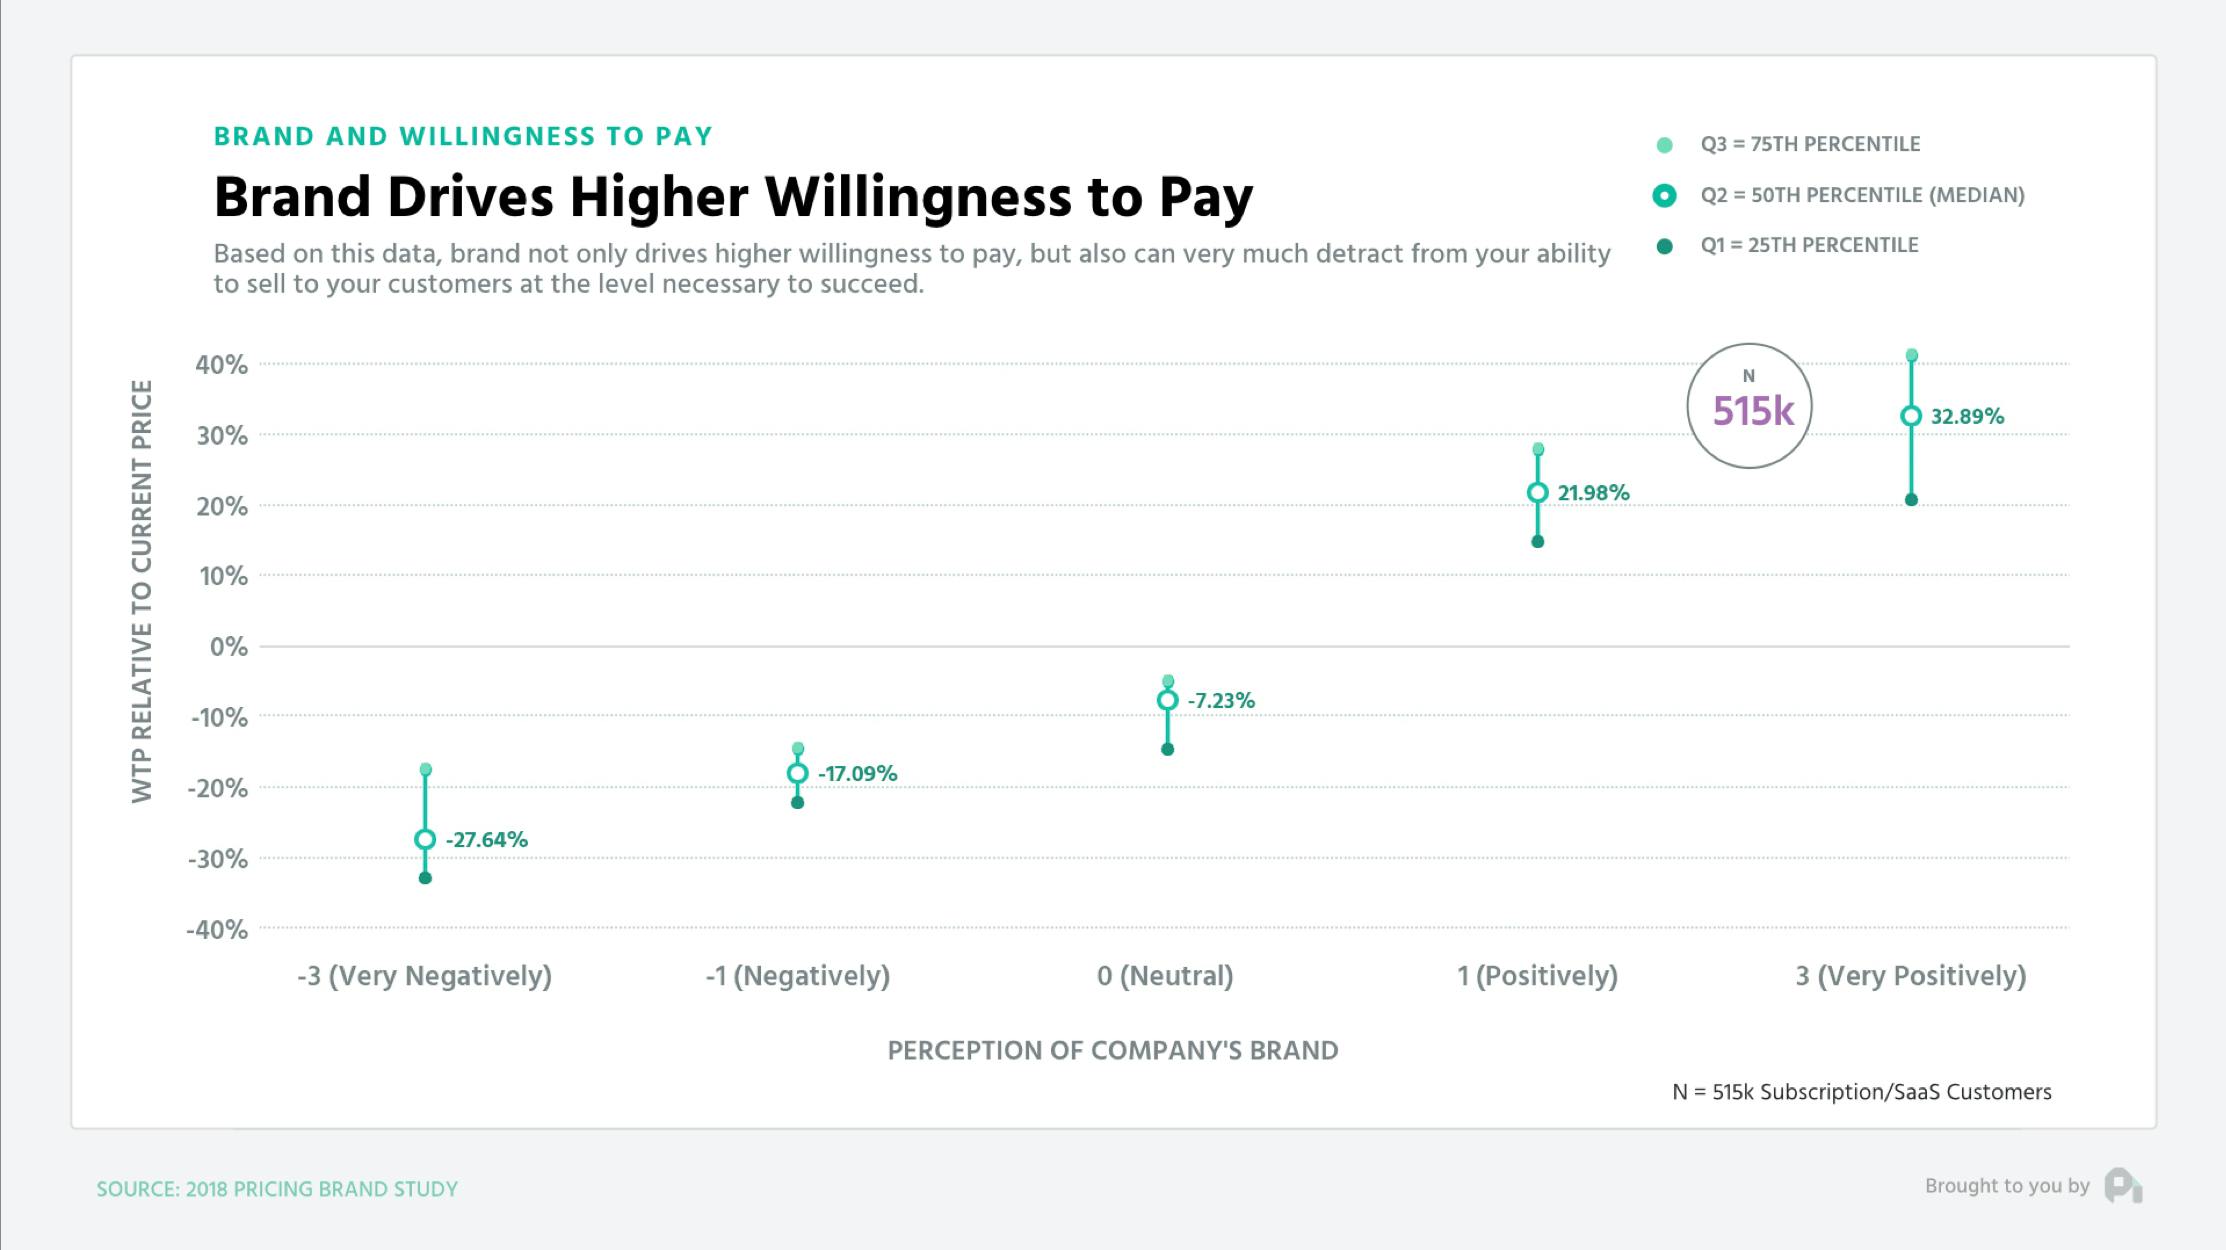
First up, one of the highest impact drivers of willingness to pay is getting your brand and support in order. When measuring a customer’s affinity for a company’s brand and then cross referencing that data with the customer’s willingness to pay we found that those customers who perceived a company’s brand positively had between a 16% and 41% higher willingness to pay than the median. Those on the negative perception side had 15-33% lower willingness to pay. Based on this data, brand not only drives higher willingness to pay, but also can very much detract from your ability to sell to your customers at the level necessary to succeed.
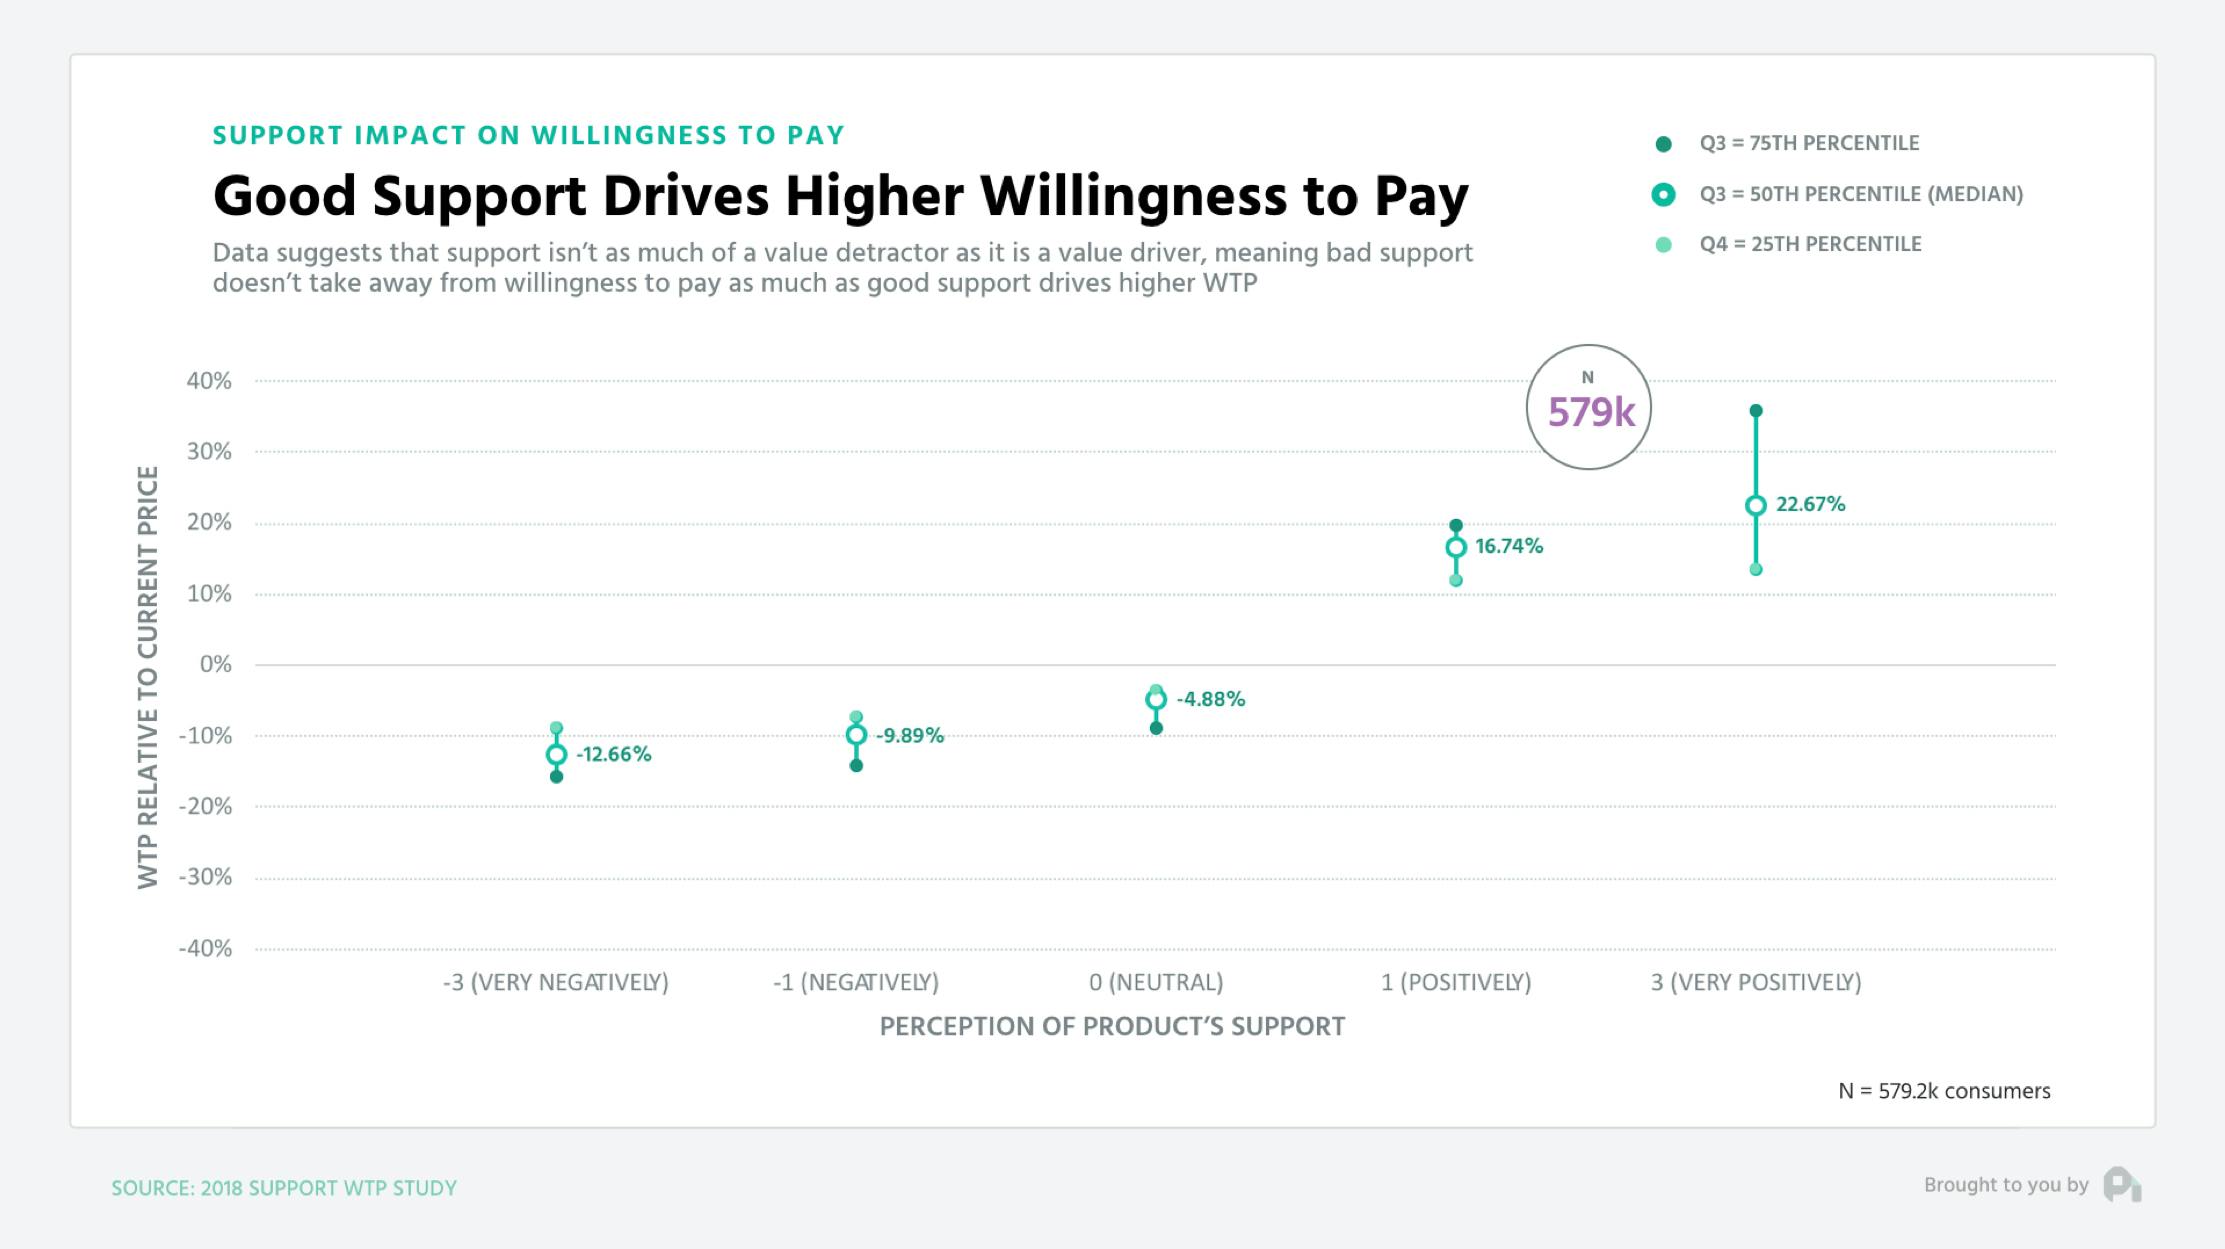
Similarly on the support front, those customers who perceived a company’s support positively had between a 12% and 36% higher willingness to pay than the median. Those on the negative perception side had 8 to 16% lower willingness to pay. This indicates that bad support isn’t taking away from willingness to pay as much as good support is driving willingness to pay.
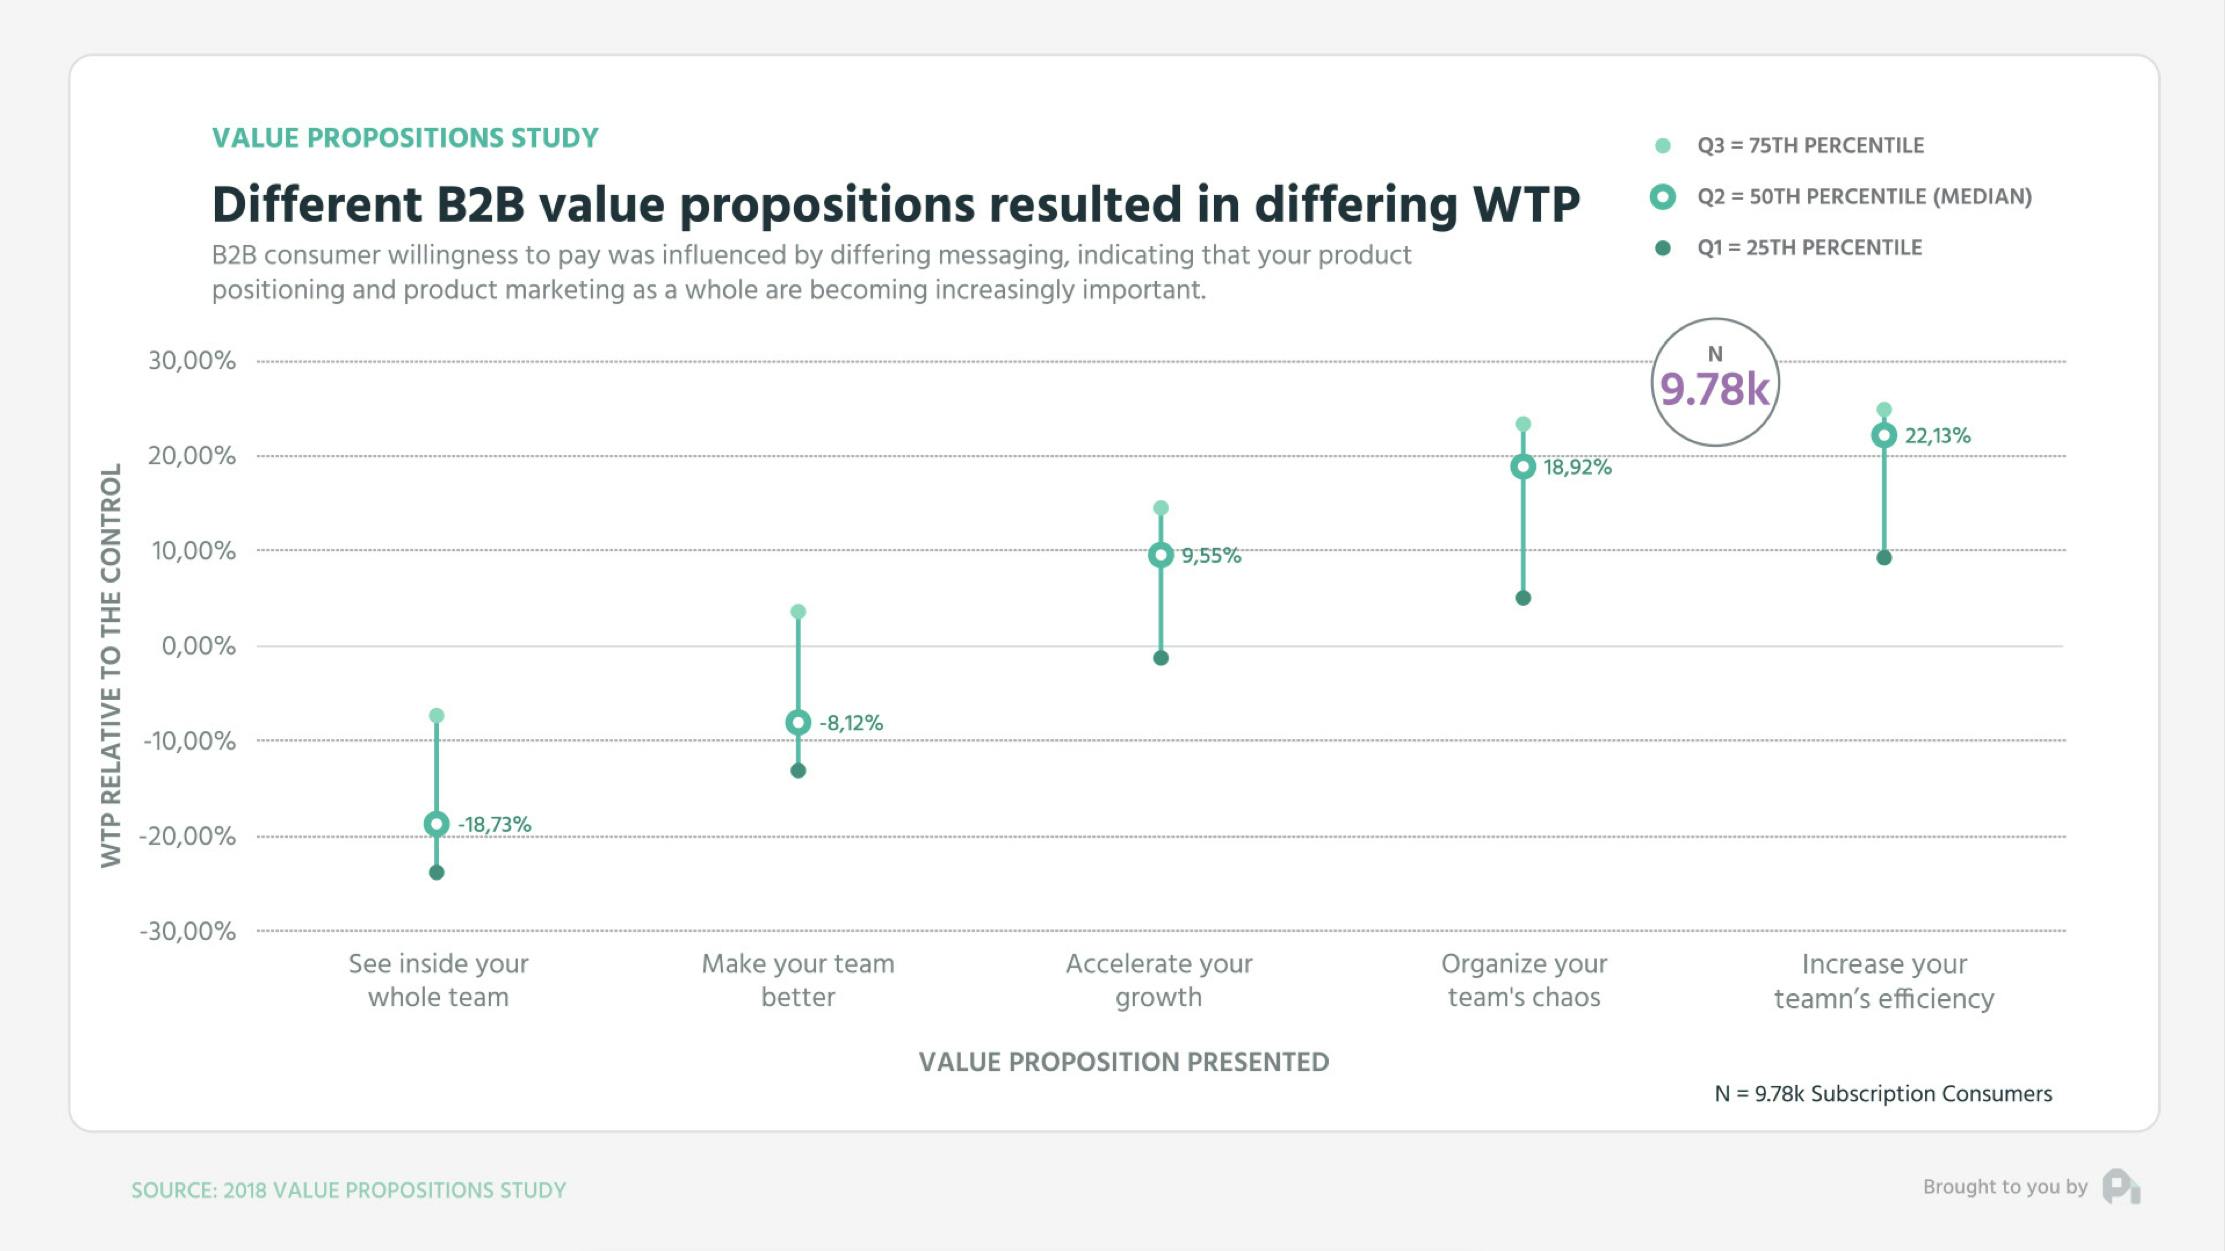
If you need a more tactical focus on willingness to pay, you should attack your value proposition. In a previous set of studies we looked at a fake B2B sales product and a fake B2C fitness product, we kept all copy and descriptions the same except we varied the value proposition. For both products we found that the value proposition caused a large variance in willingness to pay.
For the B2B product, certain value proposition were able to decrease willingness to pay by 20% while other were able to increase willingness to pay by 20%.
Our B2C example saw the same effect with a negative 10% to a plus 15% swing based on the value proposition. Essentially, how you position your product can greatly influence the value perception from a customer.
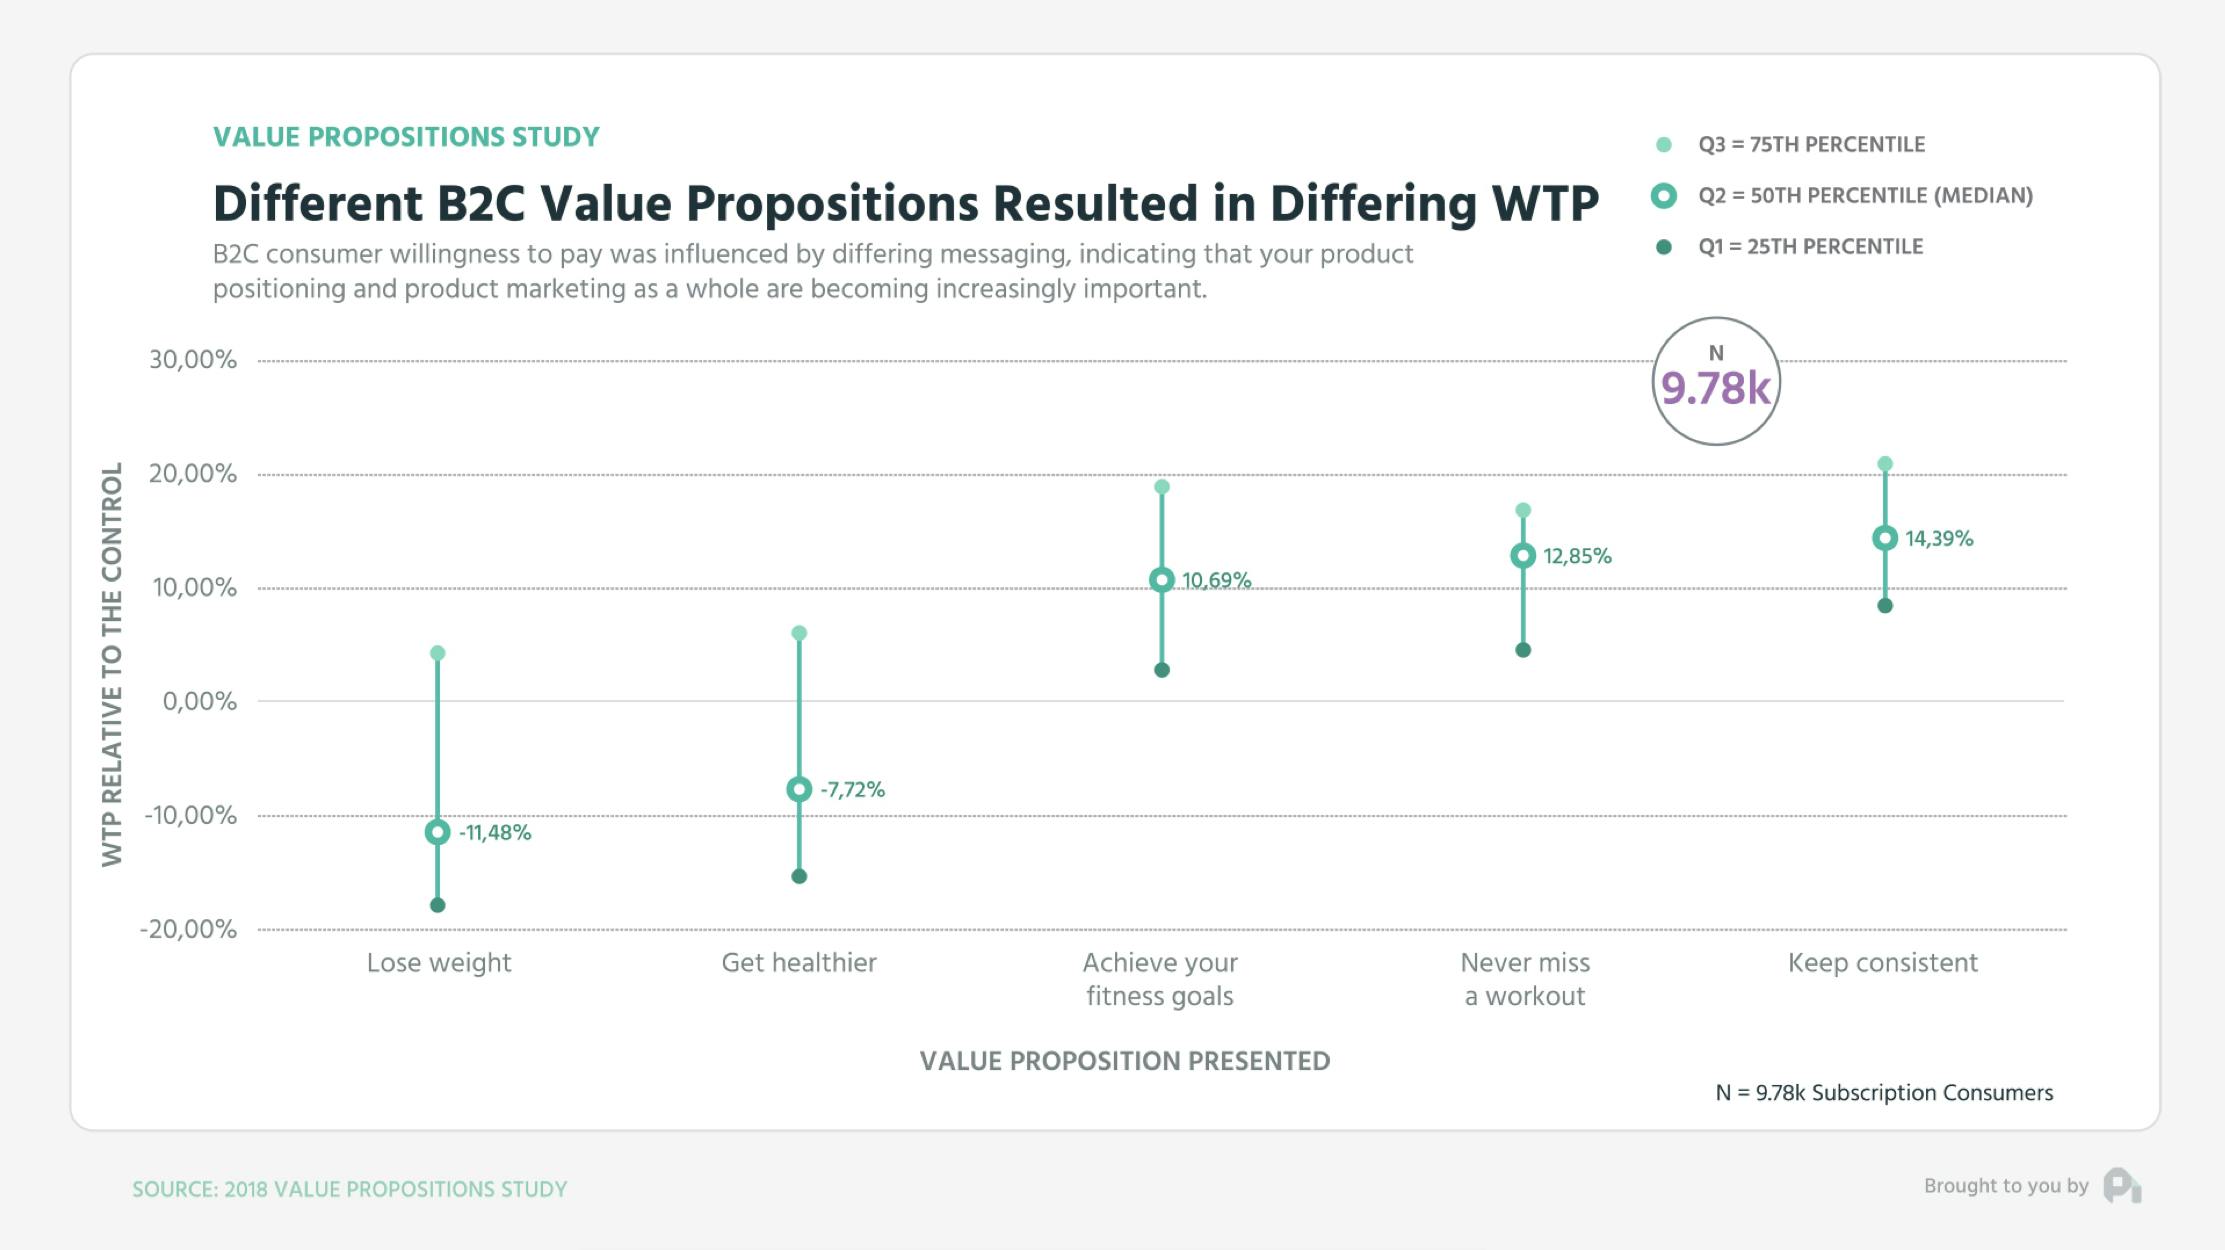
Finally, make sure you revisit the social proof you’ve implemented around your product and purchasing funnel. In both B2B and B2C displaying customer logos and providing testimonials increased willingness to pay considerably.
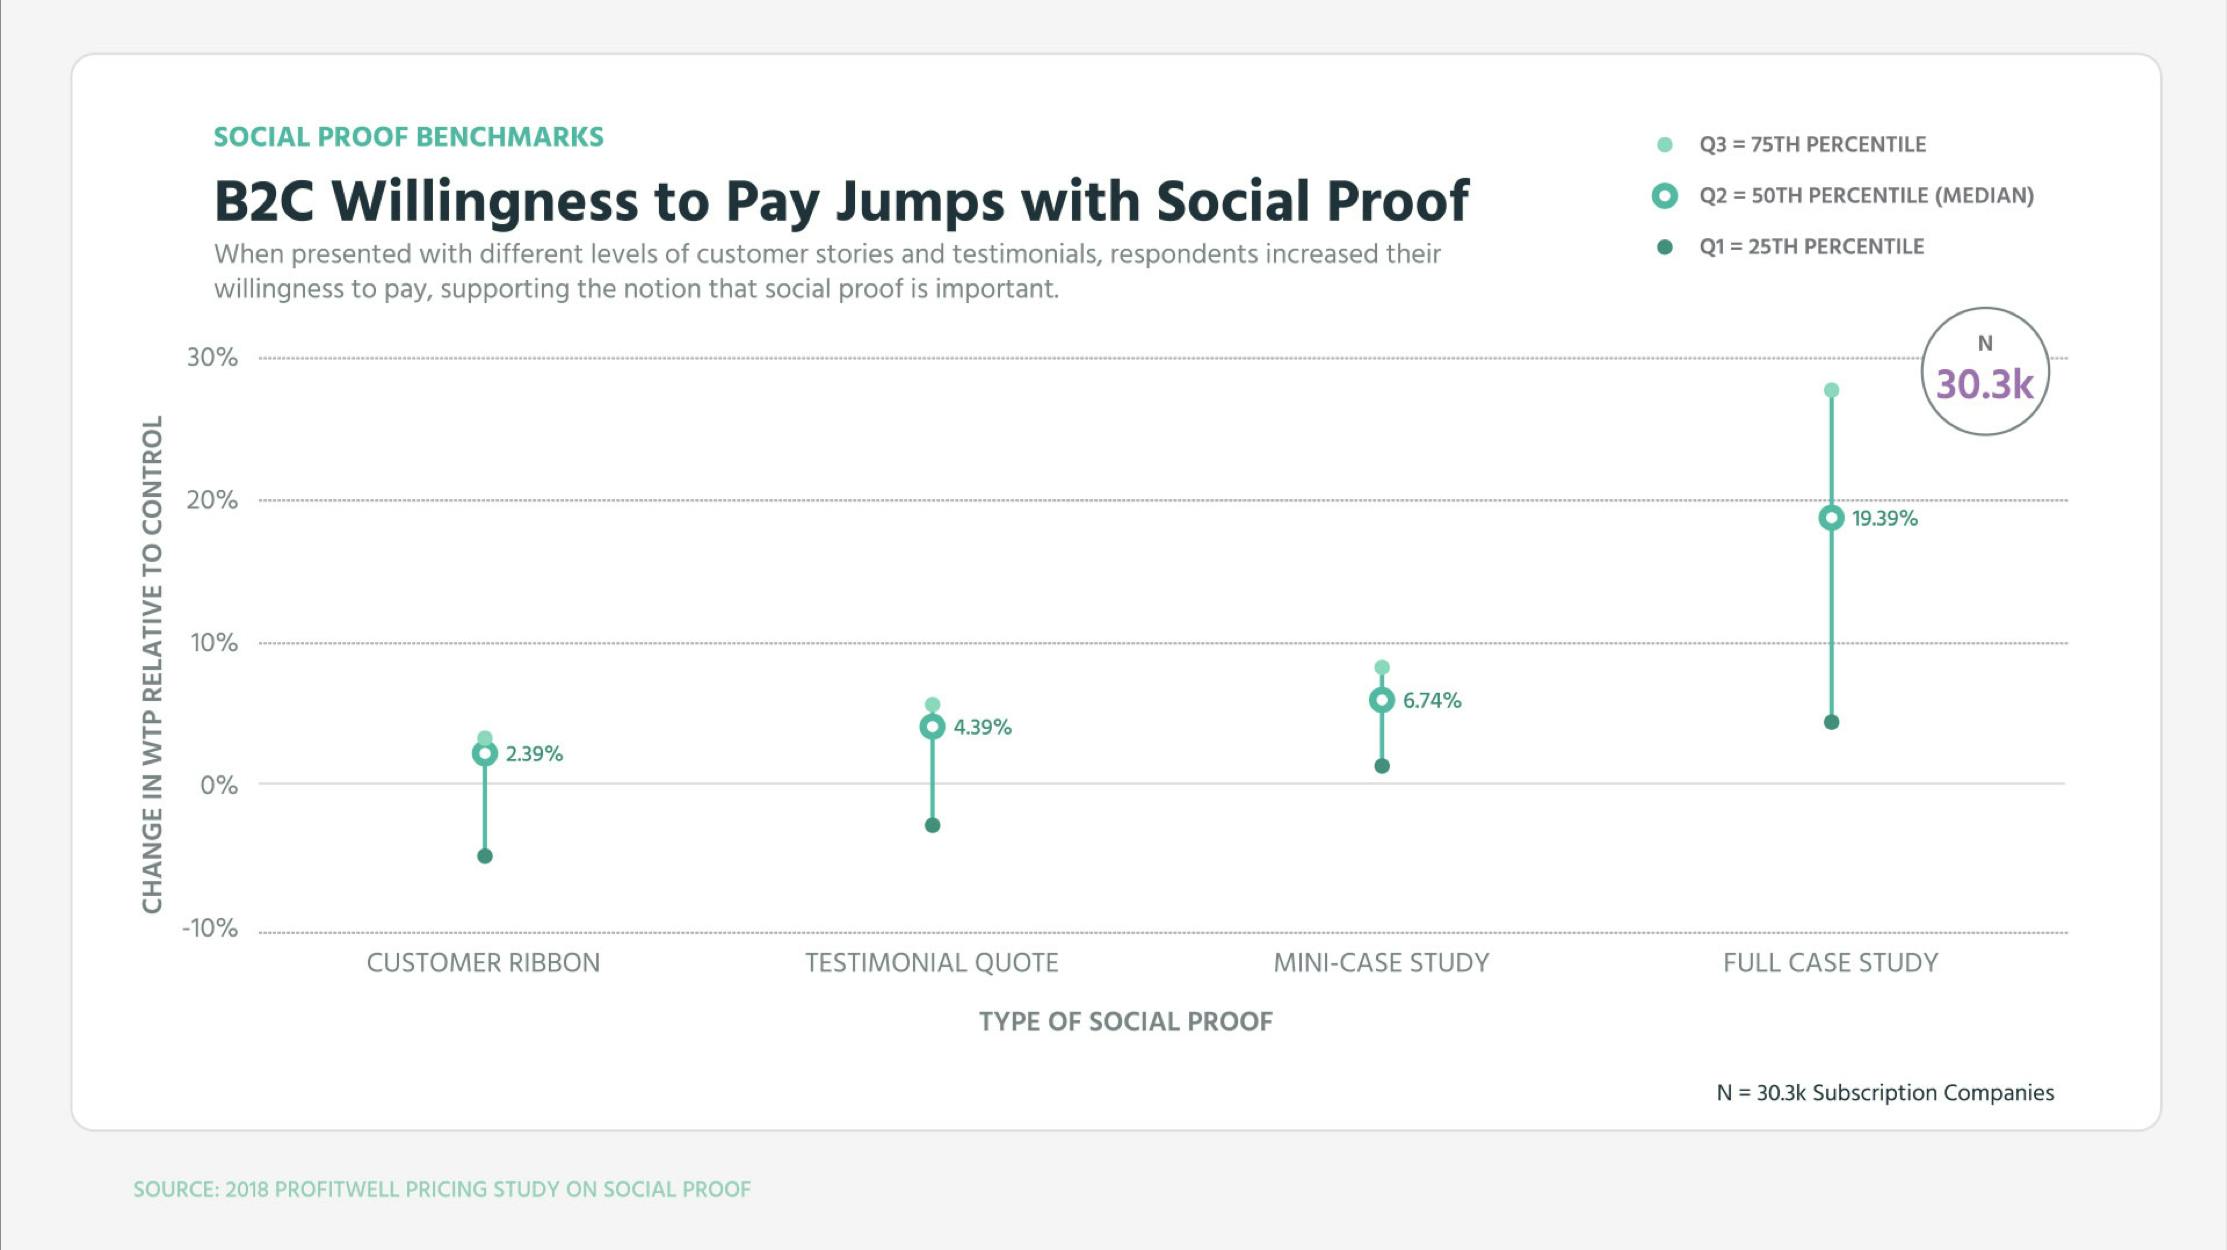
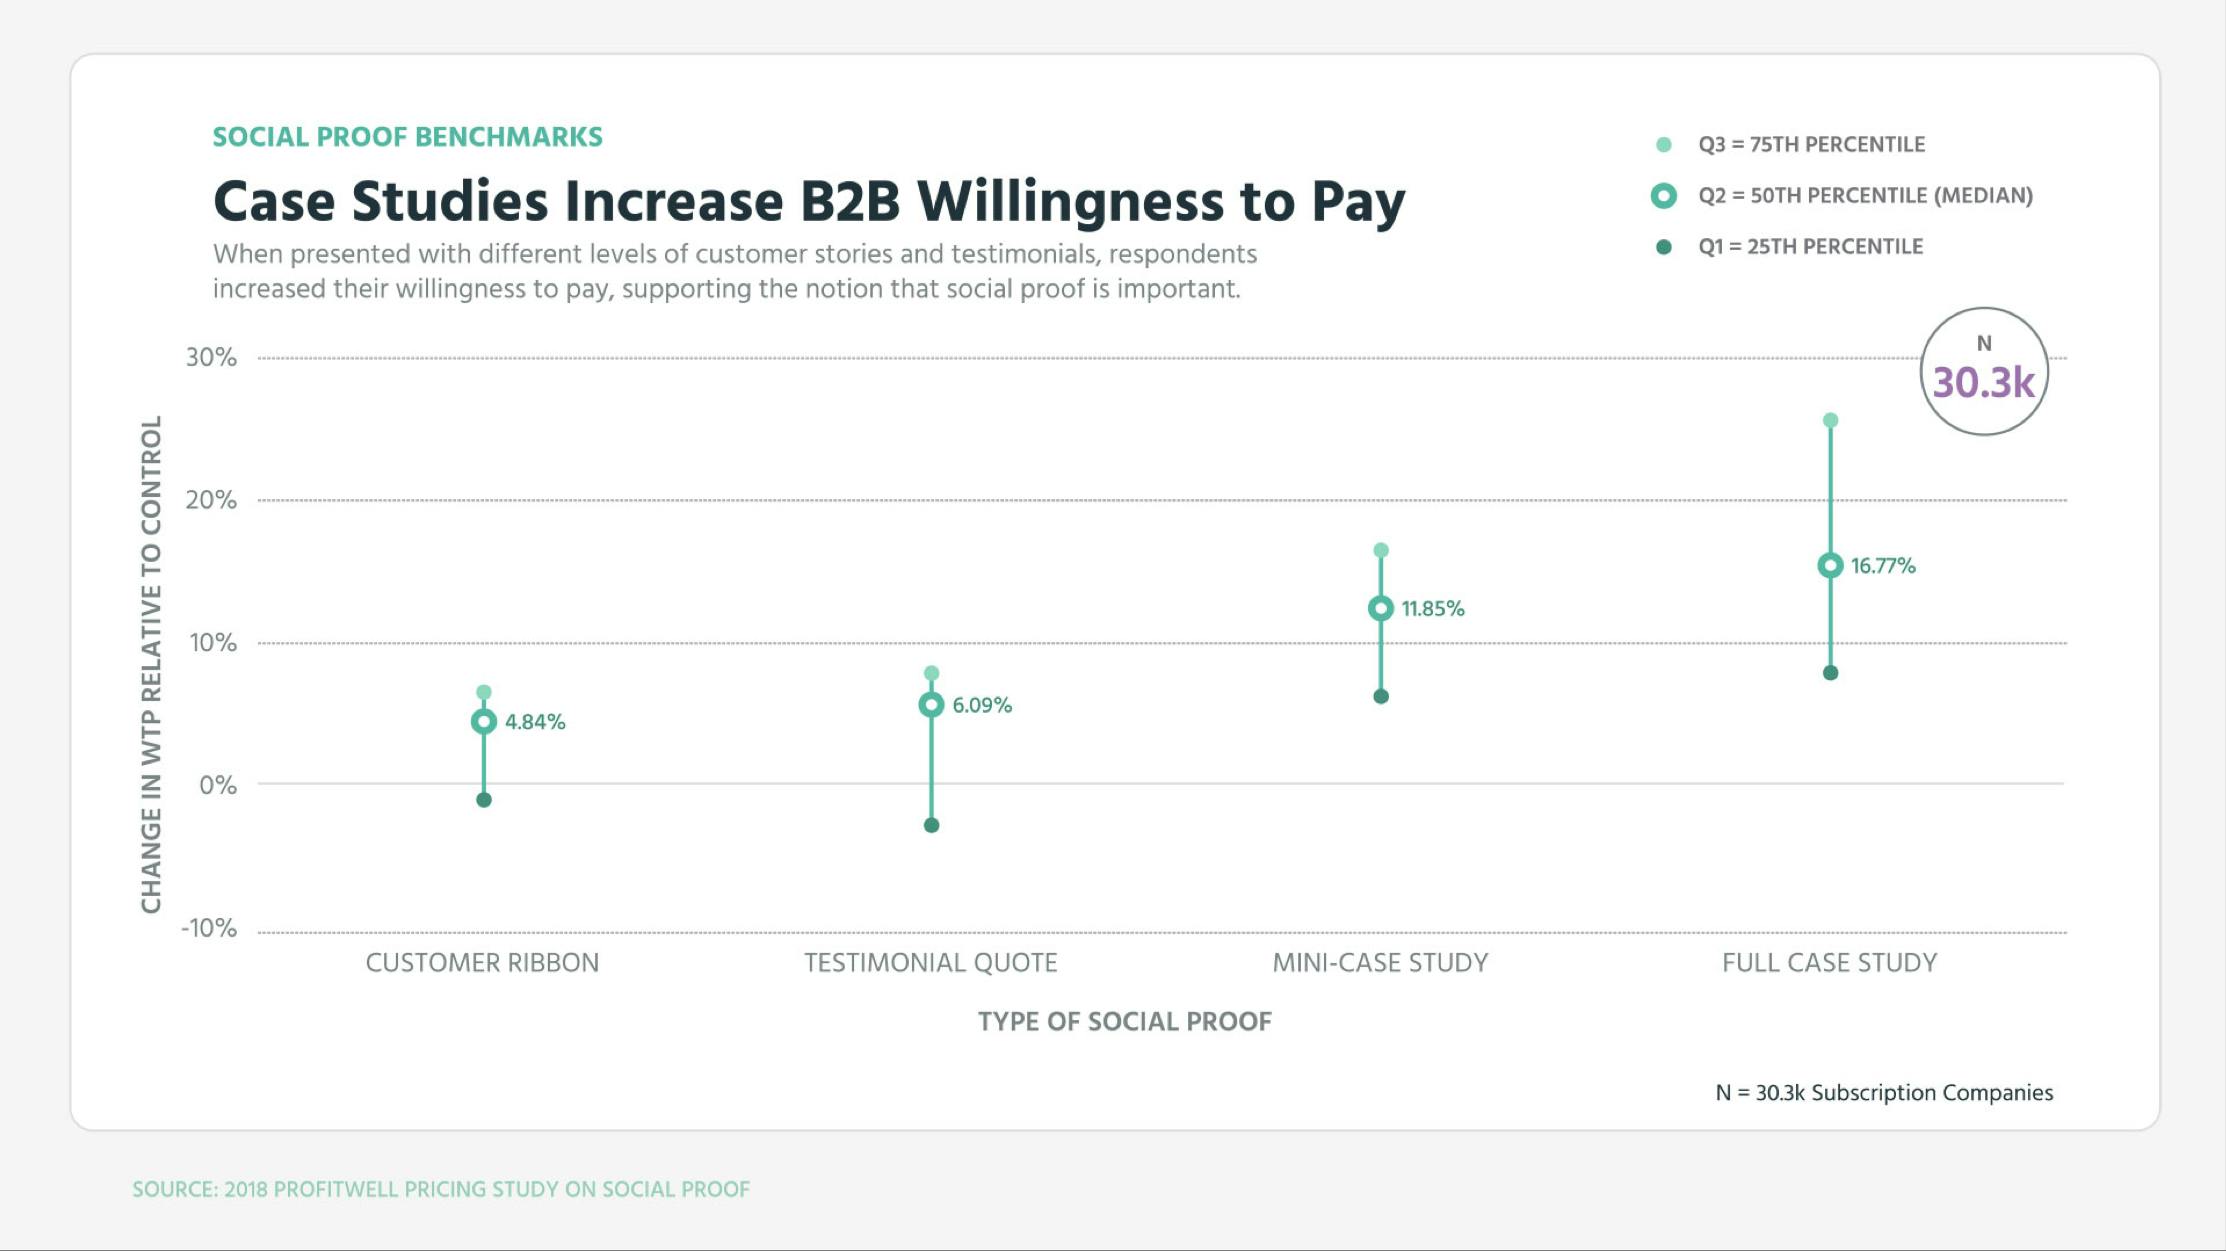
On the B2B side case studies increased willingness to pay by 10 to 15%. In B2C these case studies boosted willingness to pay from 5 to 20% with specific case studies having the biggest effect.
Remember with all of these tactics your aim is to make sure your prospect or customer understands the value they’re getting when it comes to your product. Since price is the exchange rate on the value you’re providing, these pieces of communication allow your prospect and customer to understand your value at a deep level, which ultimately allows you to get what you’re worth.
Want to learn more? Check out our recent episode on How to Increase Expansion Revenue Quickly and subscribe to the show to get new episodes.

1
00:00:00,320 --> 00:00:03,520
You've got the questions,
and we have the data.
2
00:00:03,520 --> 00:00:06,620
This is the ProfitWell Report.
3
00:00:08,545 --> 00:00:09,185
Hi, Neil.
4
00:00:09,185 --> 00:00:11,905
This is Leo, head of business
intelligence at Chartbeat,
5
00:00:11,905 --> 00:00:15,585
and I wanted to ask you
which tactics will increase
6
00:00:15,585 --> 00:00:17,105
willingness to pay.
7
00:00:17,105 --> 00:00:17,900
Welcome
8
00:00:23,380 --> 00:00:25,915
phenomenal aspect of the
subscription and SaaS economy
9
00:00:25,915 --> 00:00:28,955
is that we now have the ability
to build features and other
10
00:00:28,955 --> 00:00:32,395
value adding functionality into
our products extremely quickly.
11
00:00:32,395 --> 00:00:35,570
Yet understanding what your
customers or target customers
12
00:00:35,570 --> 00:00:38,770
value and making sure you're
using data to get the persona
13
00:00:38,770 --> 00:00:42,315
pricing fit can take quite some
time as it's an ongoing process
14
00:00:42,315 --> 00:00:44,535
of continual price optimization.
15
00:00:44,715 --> 00:00:45,435
We all know that,
16
00:00:45,435 --> 00:00:48,615
especially if you've read
almost anything we've published.
17
00:00:48,680 --> 00:00:49,800
While you're doing this,
18
00:00:49,800 --> 00:00:53,320
what tactical things can you
do to increase willingness to pay?
19
00:00:53,320 --> 00:00:54,360
To answer this question,
20
00:00:54,360 --> 00:00:57,005
we looked at the data from
just over one million different
21
00:00:57,005 --> 00:01:00,605
subscription consumers and just
under two thousand companies.
22
00:01:00,605 --> 00:01:02,285
Here's what we found.
23
00:01:02,285 --> 00:01:05,390
First up, one of the highest impact
drivers of willingness to pay
24
00:01:05,390 --> 00:01:07,950
is getting your brand
and support in order.
25
00:01:07,950 --> 00:01:10,510
When measuring a customer's
affinity for a company's brand
26
00:01:10,510 --> 00:01:12,955
and then cross referencing
that data with the customer's
27
00:01:12,955 --> 00:01:14,395
willingness to pay,
28
00:01:14,395 --> 00:01:17,435
we found that those customers
who perceived a company's brand
29
00:01:17,435 --> 00:01:20,555
positively had between a
sixteen and forty one percent
30
00:01:20,555 --> 00:01:22,720
higher willingness to
pay than the median.
31
00:01:22,840 --> 00:01:25,320
Those on the negative
perception side had fifteen to
32
00:01:25,320 --> 00:01:27,880
thirty three percent
lower willingness to pay.
33
00:01:27,880 --> 00:01:29,080
Based on this data,
34
00:01:29,080 --> 00:01:31,595
brand not only drives a
higher willingness to pay,
35
00:01:31,595 --> 00:01:34,475
but can also very much detract
from your ability to sell to
36
00:01:34,475 --> 00:01:37,675
your customers at the
level necessary to succeed.
37
00:01:37,675 --> 00:01:39,480
Similarly, on the support front,
38
00:01:39,480 --> 00:01:42,920
those customers who perceived
a company's support positively
39
00:01:42,920 --> 00:01:46,040
had between a twelve and thirty
six percent higher willingness
40
00:01:46,040 --> 00:01:47,480
to pay than the median.
41
00:01:47,480 --> 00:01:50,725
Those on the negative side
had eight to sixteen percent lower
42
00:01:50,725 --> 00:01:51,925
willingness to pay.
43
00:01:51,925 --> 00:01:54,565
This indicates that bad
support isn't taking away from
44
00:01:54,565 --> 00:01:57,205
willingness to pay as much
as good support is driving
45
00:01:57,205 --> 00:01:58,700
willingness to to pay.
46
00:01:58,700 --> 00:02:01,260
If you need a more tactical
focus on willingness to pay,
47
00:02:01,260 --> 00:02:03,500
you should attack your
value proposition.
48
00:02:03,500 --> 00:02:04,700
In a previous set of studies,
49
00:02:04,700 --> 00:02:07,785
we looked at a fake b to b
sales product and a fake b to c
50
00:02:07,785 --> 00:02:08,985
fitness product,
51
00:02:08,985 --> 00:02:11,545
and we kept all of the copy
and descriptions the same,
52
00:02:11,545 --> 00:02:14,025
except we varied the
value proposition.
53
00:02:14,025 --> 00:02:14,905
For both products,
54
00:02:14,905 --> 00:02:17,110
we found that the value
proposition caused a large
55
00:02:17,110 --> 00:02:18,790
variance in willingness to pay.
56
00:02:18,790 --> 00:02:19,830
For the b to b product,
57
00:02:19,830 --> 00:02:22,470
certain value propositions were
able to decrease willingness to
58
00:02:22,470 --> 00:02:23,750
pay by twenty percent,
59
00:02:23,750 --> 00:02:27,655
while others were able to increase
willingness to pay by twenty percent.
60
00:02:27,675 --> 00:02:30,555
Our b to c examples have the
same effect with a negative ten
61
00:02:30,555 --> 00:02:33,755
to fifteen percent swing based
on that value proposition.
62
00:02:33,755 --> 00:02:37,260
Essentially, how you position your
product can greatly influence the value
63
00:02:37,260 --> 00:02:39,180
perception from a customer.
64
00:02:39,180 --> 00:02:42,380
Finally, make sure you revisit the
social proof you've implemented
65
00:02:42,380 --> 00:02:44,735
around your product
and purchasing funnel.
66
00:02:44,735 --> 00:02:46,735
In both b to b and b to c,
67
00:02:46,735 --> 00:02:49,935
displaying customer logos and
providing testimonials increase
68
00:02:49,935 --> 00:02:51,915
willingness to pay considerably.
69
00:02:51,970 --> 00:02:53,170
On the b to b side,
70
00:02:53,170 --> 00:02:56,990
case studies increased willingness
to pay by ten to fifteen percent.
71
00:02:57,010 --> 00:02:58,050
In b to c,
72
00:02:58,050 --> 00:03:01,090
these case studies boosted willingness
to pay from five to twenty percent,
73
00:03:01,090 --> 00:03:04,615
with specific case studies
having the biggest impact.
74
00:03:04,875 --> 00:03:06,635
Remember, with
all these tactics,
75
00:03:06,635 --> 00:03:09,035
your aim is to make sure
your prospect or customer
76
00:03:09,035 --> 00:03:12,810
understands the value they're getting
when it comes to your product.
77
00:03:12,810 --> 00:03:15,610
Since price is literally the
exchange rate on the value
78
00:03:15,610 --> 00:03:16,650
you're providing,
79
00:03:16,650 --> 00:03:20,545
these pieces of communication allow
your prospecting customer deep level,
80
00:03:20,545 --> 00:03:21,603
which ultimately allows you
to get what you're worth.
81
00:03:21,603 --> 00:03:22,191
Well, that's it for now.
82
00:03:22,191 --> 00:03:23,665
If you have any questions,
83
00:03:23,665 --> 00:03:26,685
send me an email or
video to neil at profilol
84
00:03:29,400 --> 00:03:29,800
dot com.
85
00:03:29,800 --> 00:03:32,760
And if you got value here or
any other week of the report,
86
00:03:32,760 --> 00:03:35,240
we appreciate you sharing
on Twitter and LinkedIn because
87
00:03:35,240 --> 00:03:37,320
that's how we know if we
should keep doing this.
88
00:03:37,320 --> 00:03:39,145
I'll see you next week.
89
00:03:41,105 --> 00:03:44,065
This week's episode is brought
to you by Chorus dot ai.
90
00:03:44,065 --> 00:03:47,380
Chorus dot ai is the market
leading conversation cloud
91
00:03:47,380 --> 00:03:49,140
built to securely
capture, store,
92
00:03:49,140 --> 00:03:52,420
and analyze your team's calls
and meetings so your team could
93
00:03:52,420 --> 00:03:53,940
focus on what really matters,
94
00:03:53,940 --> 00:03:55,786
your customers
and your business.
95
00:03:55,786 --> 00:03:57,891
Chorus dot a I.

