How Australian Subscription Companies Differ from American Ones
This episode might reference ProfitWell and ProfitWell Recur, which following the acquisition by Paddle is now Paddle Studios. Some information may be out of date.
Originally published: July 17th, 2019
One beauty of the subscription and SaaS world is the way companies have been popping up and flourishing all over the world–not just in Silicon Valley. One fascinating place with massive success stories has been Australia and New Zealand, where companies like Atlassian, Canva, SafetyCulture, and even Xero have pushed this region into the forefront of the subscription economy.
While Australian companies may not be the fastest growing, they tend to focus on experience and customer retention much better than their U.S. counterparts.
But first, if you like this kind of content and want to learn more, subscribe to get in the know when we release new episodes.

From a net promoter score standpoint, which is a measure of customer satisfaction, Australian companies in both B2B and in the consumer spaces are noticeably better than U.S. companies in similar industries. While all NPS scores have fallen over time, Australian NPS scores tend to be 15% to 30% higher.
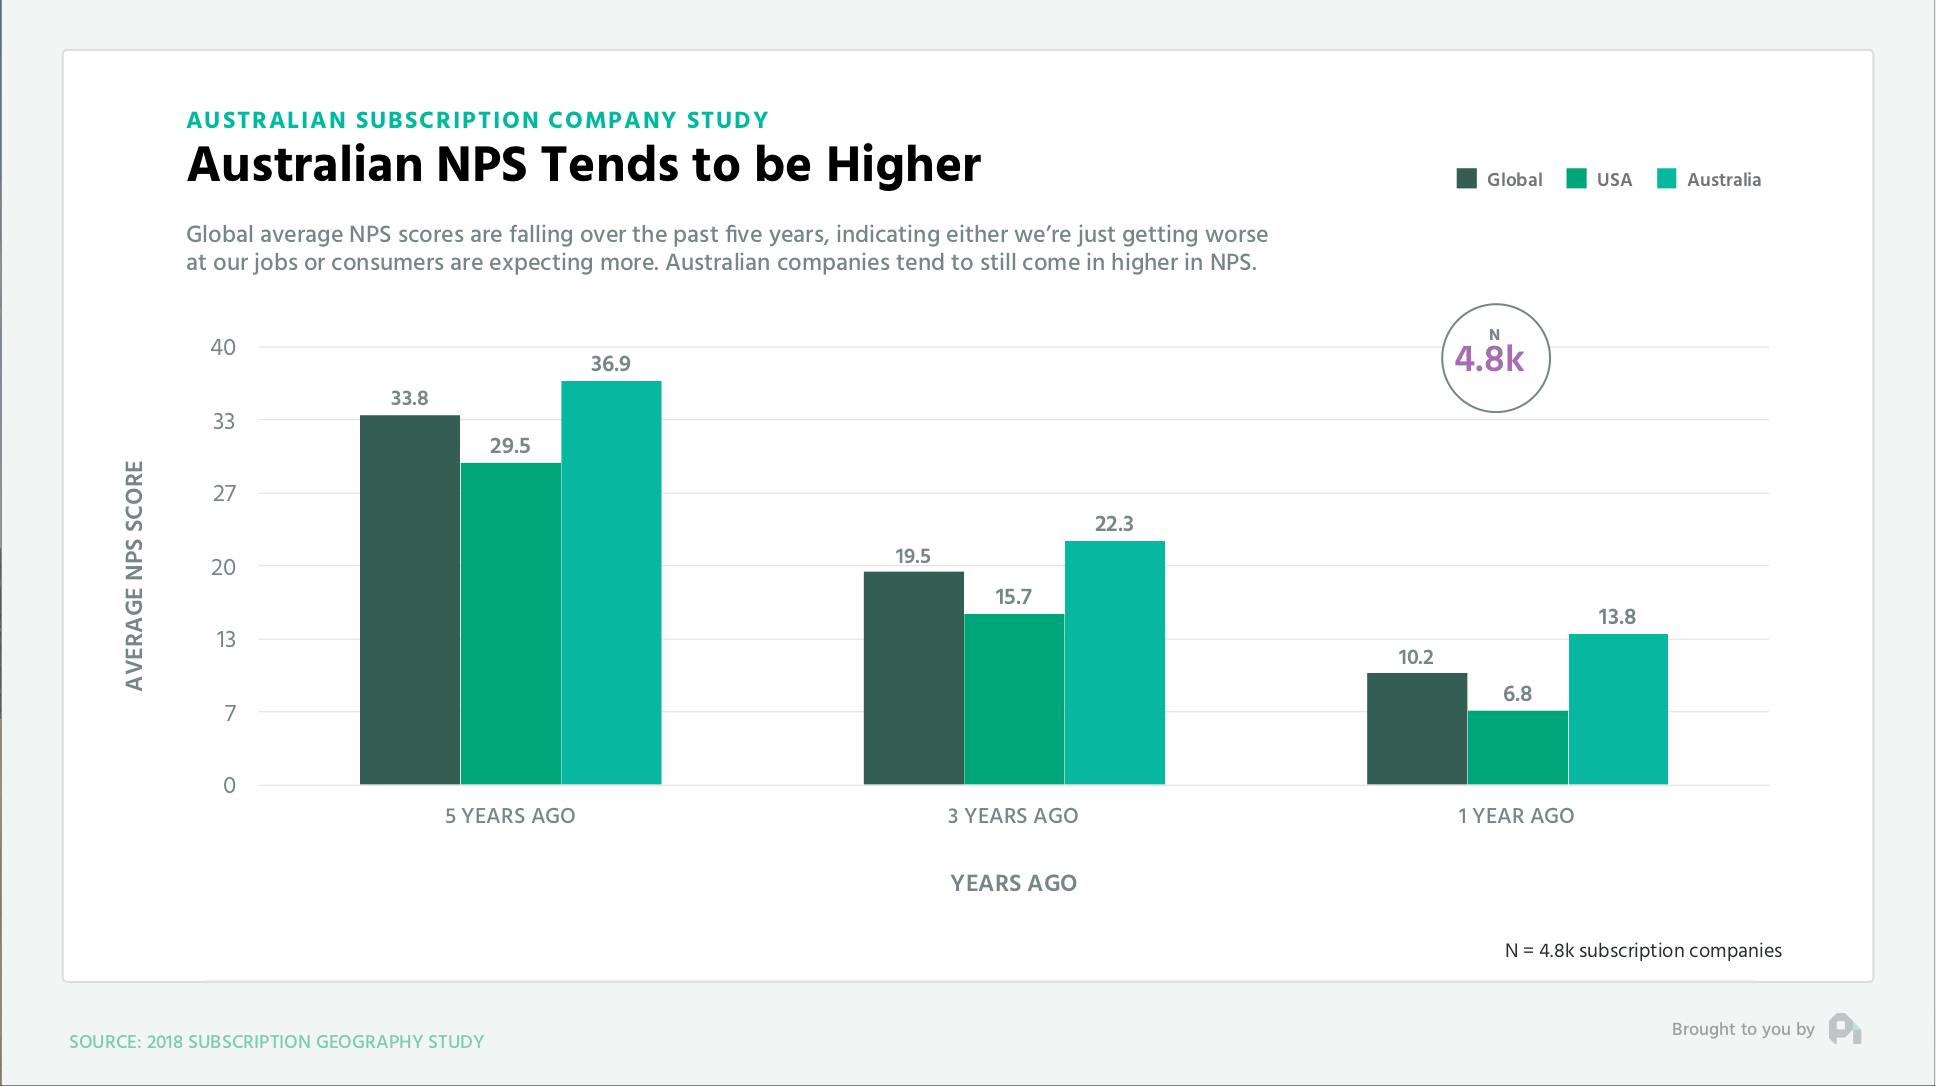
While we don’t have data that exactly gets to the why this is happening, qualitatively we tend to see that support and design quality are much better with Australian companies, where even the nerdiest enterprise B2B software products get lots of user experience love.
You see this when comparing retention numbers as well. When comparing gross revenue retention across companies selling different levels of products, you’ll notice that Australian companies consistently have 10 to 23% lower churn than their US counterparts in both B2B and B2C.
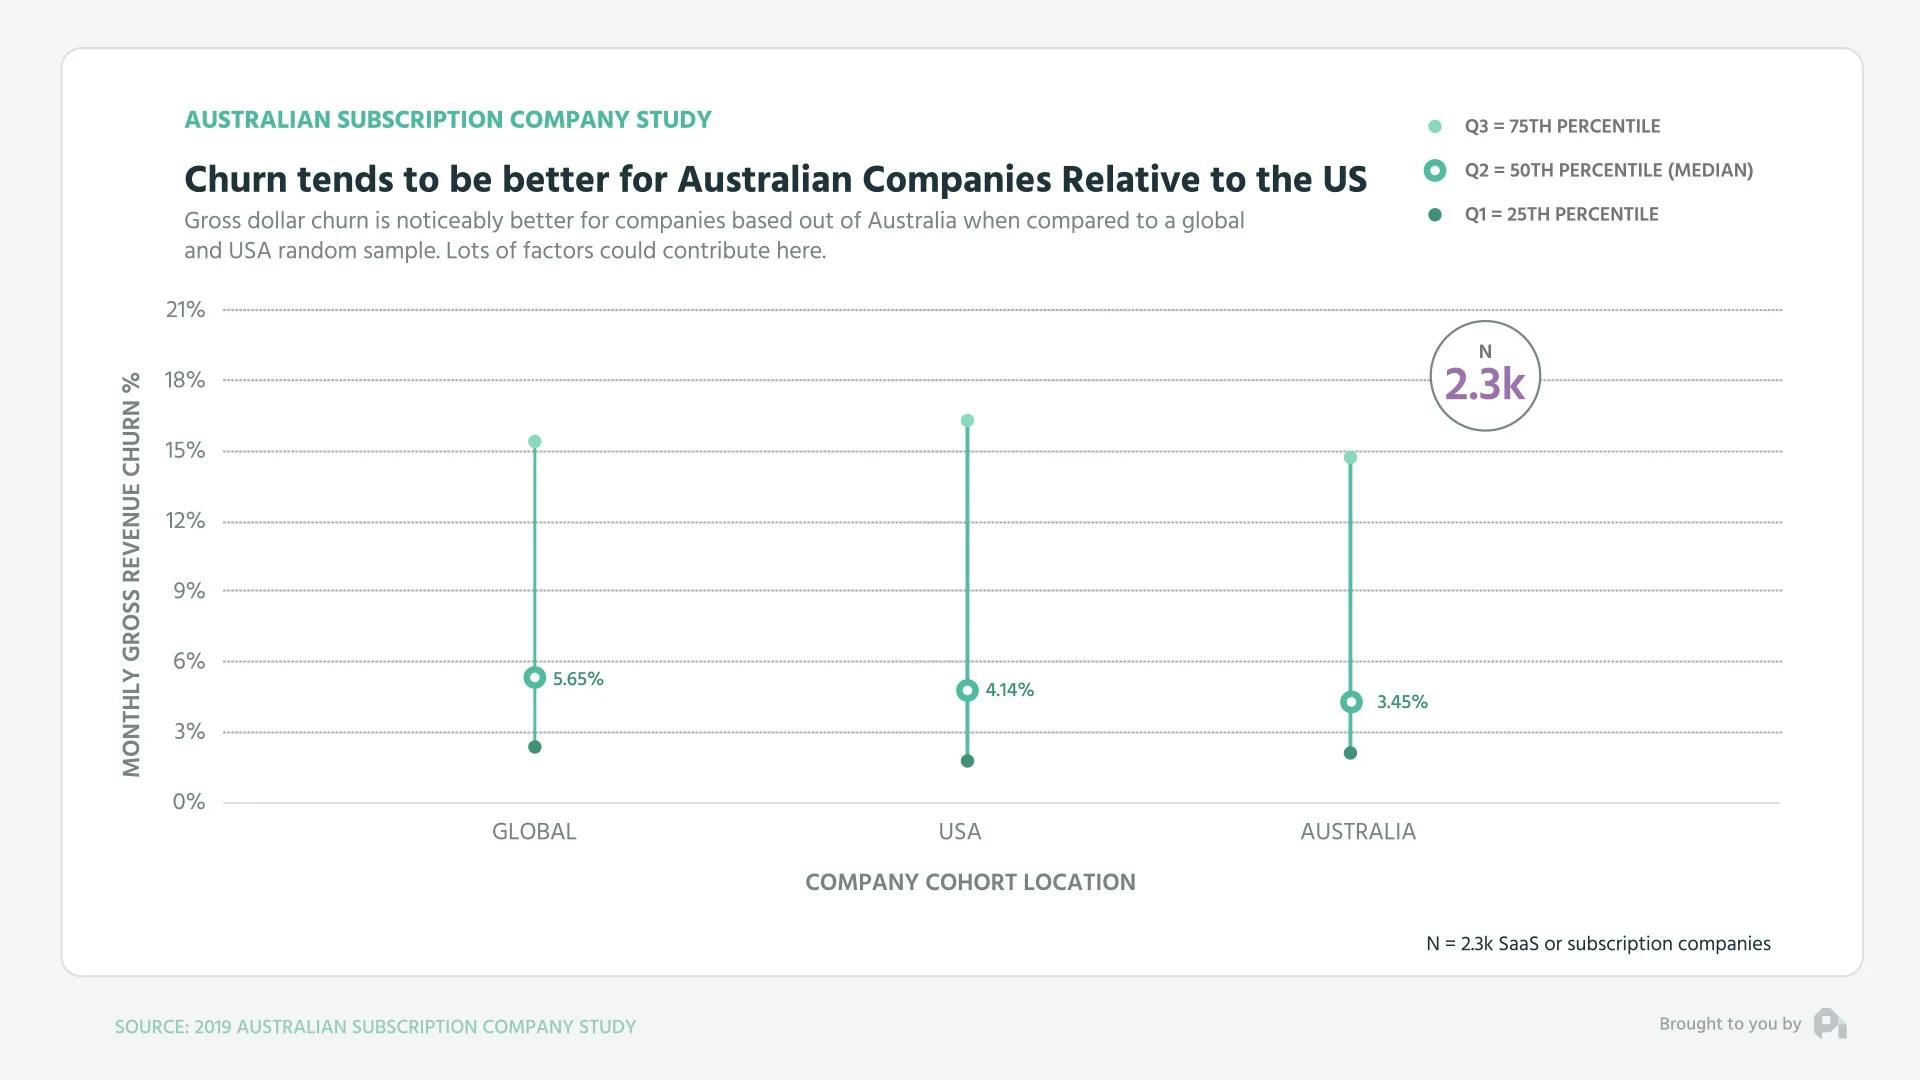
One theory here is that if you take a step back and think about how the Australian subscription economy developed, there may be a bit of a Goldilocks effect. Atlassian’s rise (Australia’s major anchor company) happened at just the right time and resulted in many other companies popping up or having an ecosystem that supported them. This all happened in the past ten years, which is right when design and great support started to be even more important. U.S. companies got that memo later, because they were able to rest on their laurels of the old guard.
So is everything better for Australian subscription companies?
Well, not exactly. Australian companies actually have much bigger problems when it comes to extracting value from their customers. When looking at the growth – or lack thereof – of the average revenue per user (ARPU) you’ll notice that overall, Australian companies are stagnant or trailing their U.S. counterparts pretty considerably.
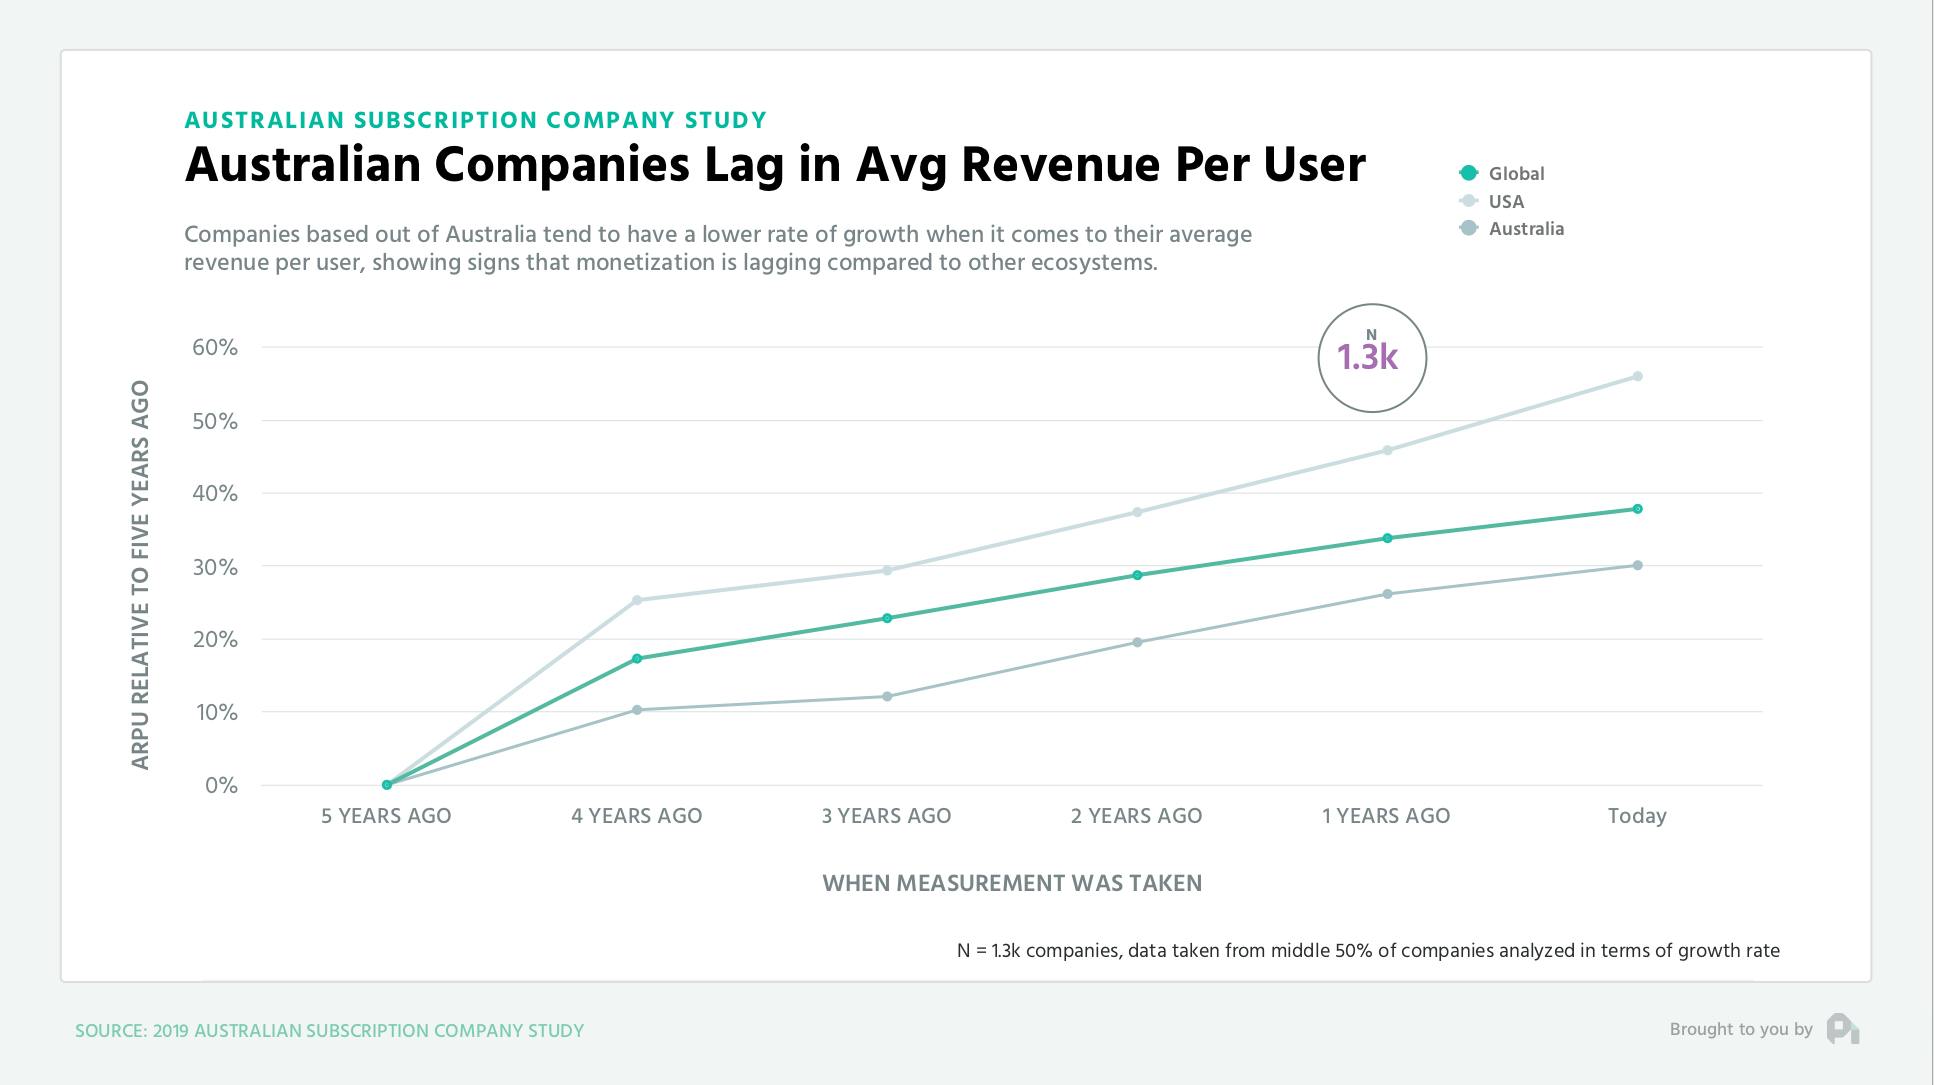
This is important to note, because your ARPU is an individualized proxy for growth when it comes to your pricing, target customer subset, and even your upgrade trajectories. If Australian companies aren’t able to grow their ARPU, then they’re running into potential problems when it comes to growth.
All that being said, the Australian ecosystem is strong, particularly because of their focus on activities that procure higher NPS and retention. There’s some work to do on actually getting the revenue that these companies are worth, but I’d rather start from a place of strength of experience than one with unhappy, churning customers.
Want to learn more? Check out our recent episode on Which Tactics Will Increase Willingness to Pay? and subscribe to the show to get new episodes.
1
00:00:00,320 --> 00:00:03,520
You've got the questions,
and we have the data.
2
00:00:03,520 --> 00:00:06,620
This is the ProfitWell Report.
3
00:00:08,595 --> 00:00:11,875
Hey, Neil. This is Sancho,
VP of marketing at Typeform.
4
00:00:11,875 --> 00:00:16,735
My question is, how do Australian
subscription companies differ from the US?
5
00:00:16,960 --> 00:00:19,500
Welcome back, everyone.
Neil here from ProfitWell.
6
00:00:19,600 --> 00:00:21,990
One deep beauty of the
subscription economy is that in
7
00:00:21,990 --> 00:00:24,275
the wake of place
8
00:00:32,285 --> 00:00:34,940
with massive success place with
massive success stories has
9
00:00:34,940 --> 00:00:38,220
been Australia and New Zealand,
where companies like Elysian,
10
00:00:38,220 --> 00:00:39,660
Canva, SafetyCulture,
11
00:00:39,660 --> 00:00:42,335
and even Xero have pushed this
region into the forefront of
12
00:00:42,335 --> 00:00:43,775
the subscription economy.
13
00:00:43,775 --> 00:00:46,735
Let's explore how companies
on the Australian continent stack
14
00:00:46,735 --> 00:00:50,640
up to the US by looking at the data
from over five thousand companies.
15
00:00:50,640 --> 00:00:53,600
While Australian companies may
not be the fastest growing,
16
00:00:53,600 --> 00:00:55,920
they tend to focus on
experience and customer
17
00:00:55,920 --> 00:00:58,320
retention much better
than the US counterparts.
18
00:00:58,320 --> 00:00:58,960
From a net
19
00:00:58,960 --> 00:01:00,385
promoter score standpoint,
20
00:01:00,385 --> 00:01:03,005
which is a measure of
customer satisfaction,
21
00:01:03,105 --> 00:01:05,905
Australian companies in both
b two b and in the consumer
22
00:01:05,905 --> 00:01:10,310
spaces are noticeably better than
US companies in similar industries.
23
00:01:10,310 --> 00:01:12,950
While NPS scores have
fallen over time,
24
00:01:12,950 --> 00:01:16,795
Australian NPS scores tend to be
fifteen to thirty percent higher.
25
00:01:16,795 --> 00:01:19,355
While we don't have data that
exactly gets to why this is
26
00:01:19,355 --> 00:01:20,715
happening, qualitatively,
27
00:01:20,715 --> 00:01:23,515
we tend to see that support and
design quality are much higher
28
00:01:23,515 --> 00:01:26,690
with Australian companies where
even the nerdiest enterprise b
29
00:01:26,690 --> 00:01:29,730
to b software products get
lots of user experience love.
30
00:01:29,730 --> 00:01:32,345
You see this when comparing
retention numbers as well.
31
00:01:32,345 --> 00:01:34,985
When comparing gross revenue
retention across companies
32
00:01:34,985 --> 00:01:36,585
selling different
levels of products,
33
00:01:36,585 --> 00:01:40,090
you'll notice that Australian
companies consistently have ten
34
00:01:40,090 --> 00:01:42,410
to twenty three percent
lower churn than their US
35
00:01:42,410 --> 00:01:45,130
counterparts in both
b to b and b to c.
36
00:01:45,130 --> 00:01:47,770
One theory here is that if
you take a step back and think
37
00:01:47,770 --> 00:01:51,065
about how the Australian
subscription economy developed,
38
00:01:51,065 --> 00:01:53,945
there may be a bit of a
Goldilocks effect where at
39
00:01:53,945 --> 00:01:57,130
least in rise Australia's
major anchor company happened
40
00:01:57,130 --> 00:01:59,432
happened at just the right
time and resulted in many other companies
41
00:01:59,432 --> 00:01:59,436
popping up or having an
ecosystem that supported
42
00:01:59,436 --> 00:01:59,439
them in the past ten years,
43
00:01:59,439 --> 00:01:59,445
which is right when designing
great support started to be even
44
00:01:59,445 --> 00:01:59,446
more important.
45
00:01:59,446 --> 00:02:00,090
Companies in the US
got that memo later.
46
00:02:00,090 --> 00:02:01,190
So
47
00:02:06,645 --> 00:02:08,405
to be even more important.
48
00:02:08,405 --> 00:02:10,645
Companies in the US
got that memo later.
49
00:02:10,645 --> 00:02:13,285
So is everything better for
Australian subscription companies?
50
00:02:13,285 --> 00:02:14,890
Well, not exactly.
51
00:02:14,890 --> 00:02:17,370
Australian companies actually
have much bigger problems when
52
00:02:17,370 --> 00:02:19,770
it comes to extracting
value from their customers.
53
00:02:19,770 --> 00:02:23,555
When looking at the growth or
lack thereof of the average
54
00:02:31,130 --> 00:02:33,930
important to note because your
ARPU is an individualized proxy
55
00:02:33,930 --> 00:02:36,010
for growth when it
comes to your pricing,
56
00:02:36,010 --> 00:02:39,210
target customer subset, and
even your upgrade trajectories.
57
00:02:39,210 --> 00:02:41,915
If Australian companies aren't
able to grow their ARPU,
58
00:02:41,915 --> 00:02:44,955
then they're running into potential
problems when it comes to growth.
59
00:02:44,955 --> 00:02:48,530
All that being said, the
Australian ecosystem is strong,
60
00:02:48,530 --> 00:02:50,850
particularly because of their
focus on activities that
61
00:02:50,850 --> 00:02:53,330
procure higher
NPS and retention.
62
00:02:53,330 --> 00:02:55,410
There's some work to do on
actually getting the revenue
63
00:02:55,410 --> 00:02:56,690
that these companies are worth,
64
00:02:56,690 --> 00:02:59,605
but I'd rather start from a
place of strength of experience
65
00:02:59,605 --> 00:03:02,385
than one with unhappy
churning customers.
66
00:03:02,485 --> 00:03:03,845
Well, that's it for now.
67
00:03:03,845 --> 00:03:04,885
If you have any questions,
68
00:03:04,885 --> 00:03:07,720
send me an email or video to
neil at profitable dot dot com.
69
00:03:07,720 --> 00:03:10,200
If you got value today
or any other episode,
70
00:03:10,200 --> 00:03:12,680
we appreciate any and all
shares on Twitter and LinkedIn
71
00:03:12,680 --> 00:03:14,465
because that's how we
know to keep going.
72
00:03:14,465 --> 00:03:16,525
I will see you next week.
73
00:03:18,385 --> 00:03:20,945
This week's episode is
brought to you by ClassPass.
74
00:03:20,945 --> 00:03:22,790
Committing is hard, so don't.
75
00:03:22,790 --> 00:03:24,950
Work out at any gym,
try any workout,
76
00:03:24,950 --> 00:03:26,710
and do it all with one app.
77
00:03:26,710 --> 00:03:30,850
Try ClassPass absolutely
free. Classpass dot com.