
Average Revenue Churn Rate Benchmarks
This episode might reference ProfitWell and ProfitWell Recur, which following the acquisition by Paddle is now Paddle Studios. Some information may be out of date.
Originally published: June 11th, 2018
It's the silent killer in our recurring revenue businesses. But while churn is something all of us in the subscription world must deal with, knowing what does and does not influence it can help us survive and build a faster growing business.
But first, if you like this kind of content and want to learn more, subscribe to get in the know when we release new episodes.

Churn Loosely Correlates with MRR
Interestingly enough, churn is actually much higher than you typically see publicly disclosed. When looking at churn based on the size of the company, you’ll notice that churn only loosely correlates with a company’s monthly recurring revenue with wide interquartile ranges that fluctuate between 5% and 16% gross revenue churn on the low end of MRR and 2% to 8% on the high end of MRR.
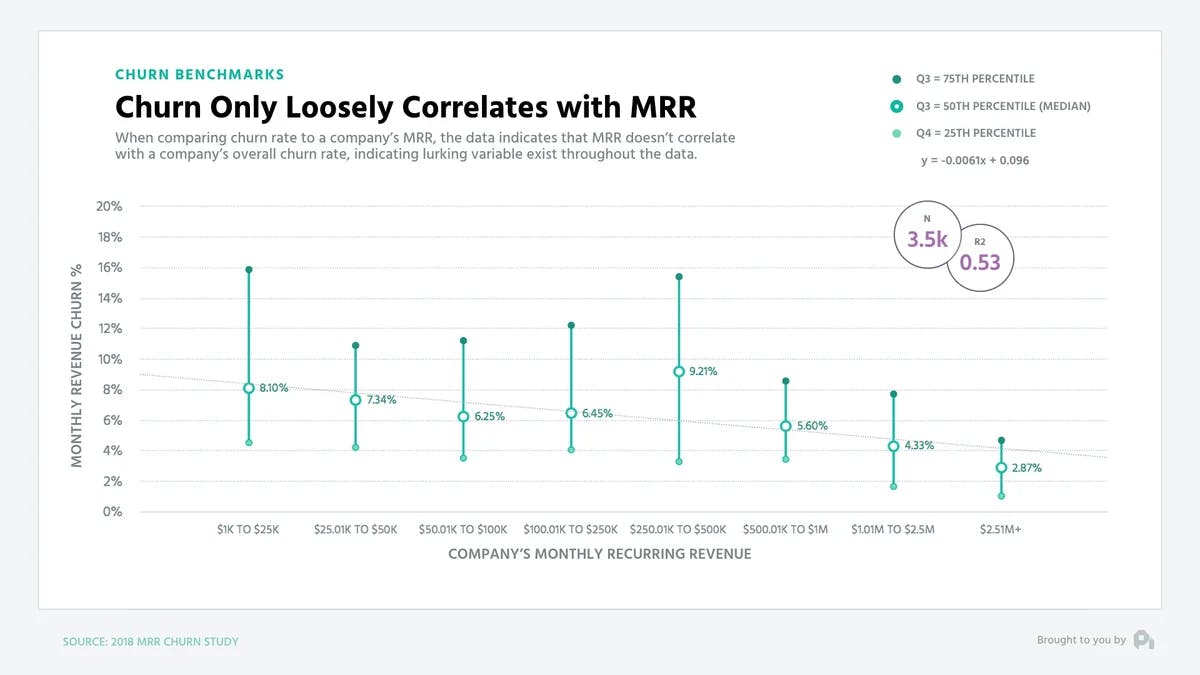
You’d expect that as a company grows, they’d be figuring out their churn, which in kind would help them grow quicker. Yet, this isn’t the case.
Company Age Shows Survivor Bias
Digging deeper down the the churn rabbit hole though we find that company age does present us with some good survivor bias when it comes to churn. Those companies who are older have dramatically lower churn than their younger counterparts. Companies who are less than three years old are seeing the interquartile range spread from 4% to a whopping 24% whereas companies who are 10 plus years old are seeing churn in the 2% to 4% range.
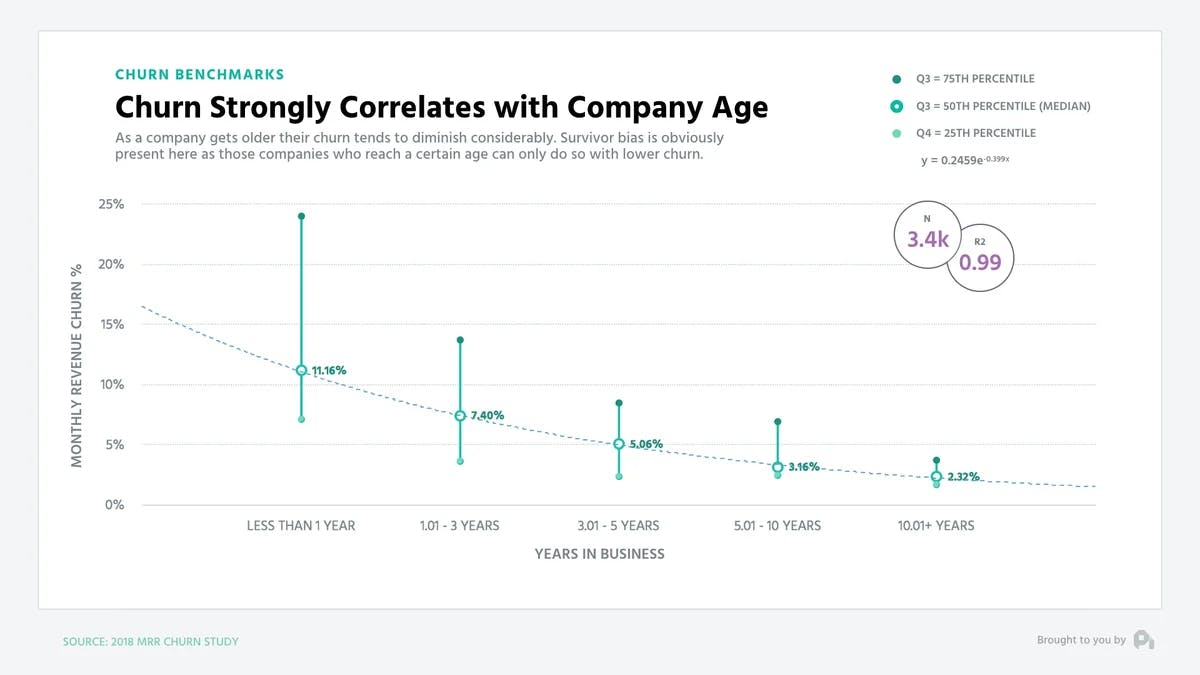
While the model fits quite nicely, these companies of course survive through properly figuring out churn, because by that time, funding, patience, or at the very least interest will dry up with poor unit economics.
Influence Churn Through Your Pricing
That being said, you can’t control your age or your MRR with the flick of a switch. You do have significant influence over your ARPU through your pricing though - and it may be time to revisit that pricing to control churn.
Those companies with low ARPUs see much higher churn than those with larger ARPU. If your average revenue per user per month is below $100, you’re likely seeing monthly gross dollar churn rates between 3 and 16% with a median between 6 and 9%. That’s a lot of churn. Yet, ARPUs over $500 see significantly less revenue churn with a range of roughly 2 to 6% and a median closer to 3-4%.
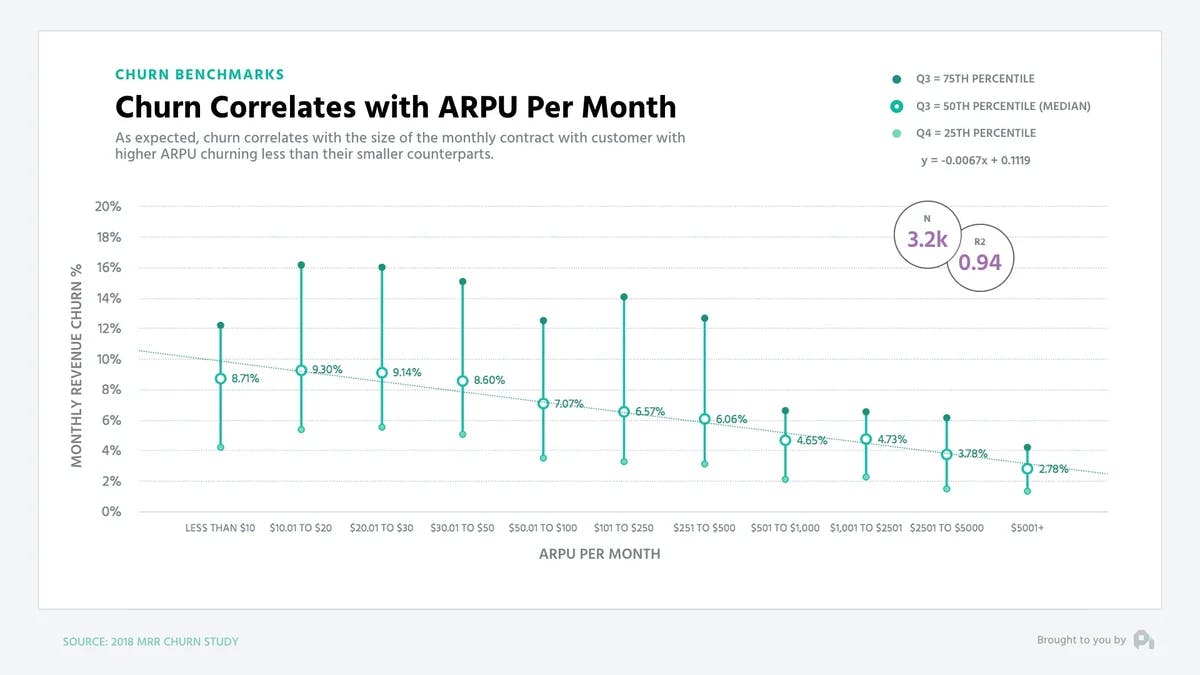
Of course, this is intuitive, as those higher ARPUs tend to come with more hand holding, annual contracts, and a deeper relationship with your customer - that which is afforded through higher revenues per user.
Ultimately though, you need to pick your poison when it comes to the company you’re building and the implications those decisions have on churn. Less churn is always more success though, and you should be fighting to reduce your churn as much as humanly possible.
Want to learn more? Check out our recent episode on Value props and willingness to pay and subscribe to the show to get new episodes.
1
00:00:00,320 --> 00:00:03,520
You've got the questions,
and we have the data.
2
00:00:03,520 --> 00:00:06,620
This is the ProfitWell Report.
3
00:00:08,935 --> 00:00:09,655
Hey, Patrick.
4
00:00:09,655 --> 00:00:12,295
This is a buy from Feather
in Gainesville, Florida.
5
00:00:12,295 --> 00:00:17,360
I'm curious about what data
you have about average logo and
6
00:00:17,360 --> 00:00:20,960
dollar churn, across
dimensions like company
7
00:00:20,960 --> 00:00:23,040
age and price point of product.
8
00:00:23,040 --> 00:00:24,645
Phenomenal question, Abe.
9
00:00:24,645 --> 00:00:28,245
Because churn is the silent killer
in our recurring revenue businesses.
10
00:00:28,245 --> 00:00:29,205
So to answer your question,
11
00:00:29,205 --> 00:00:31,685
we studied just over three
thousand subscription companies
12
00:00:31,685 --> 00:00:33,680
of all shapes,
sizes, and verticals.
13
00:00:33,680 --> 00:00:35,760
Let's jump in and
see what we found.
14
00:00:35,760 --> 00:00:36,720
Interestingly enough,
15
00:00:36,720 --> 00:00:40,240
churn is actually much higher than
you typically see publicly disclosed.
16
00:00:40,240 --> 00:00:42,785
When looking at churn based
on the size of the company,
17
00:00:42,785 --> 00:00:44,945
you'll notice that churn only
loosely correlates with the
18
00:00:44,945 --> 00:00:47,585
company's monthly recurring
revenue with wide inter
19
00:00:47,585 --> 00:00:50,470
quartile ranges that fluctuate
between five and sixteen
20
00:00:50,470 --> 00:00:53,750
percent gross revenue churn on
the low end and two to eight
21
00:00:53,750 --> 00:00:55,910
percent on the high end of MRR.
22
00:00:55,910 --> 00:00:57,990
You'd expect that
as a company grows,
23
00:00:57,990 --> 00:00:59,715
they'd be figuring
out their churn,
24
00:00:59,715 --> 00:01:01,795
which in kind would
help them grow quicker.
25
00:01:01,795 --> 00:01:03,635
Yet, this just isn't the case.
26
00:01:03,635 --> 00:01:05,555
Digging deeper down the
churn rabbit hole though,
27
00:01:05,555 --> 00:01:09,050
we find that a company age does
actually present us with some
28
00:01:09,050 --> 00:01:11,610
good survivor bias
when it comes to churn.
29
00:01:11,610 --> 00:01:14,685
Those companies who are
older have dramatically lower churn
30
00:01:14,685 --> 00:01:16,365
than their younger counterparts.
31
00:01:16,365 --> 00:01:18,605
Companies who are less than
three years old are seeing the
32
00:01:18,605 --> 00:01:22,740
interquartile range spread from four
to a whopping twenty four percent,
33
00:01:22,740 --> 00:01:25,460
whereas companies who are ten
plus years old are looking at a
34
00:01:25,460 --> 00:01:28,580
range of two to four
percent for the median.
35
00:01:28,580 --> 00:01:30,340
While the model
fits quite nicely,
36
00:01:30,340 --> 00:01:32,725
those companies of course
survive through properly
37
00:01:32,725 --> 00:01:33,845
figuring out their churn,
38
00:01:33,845 --> 00:01:36,885
because that time funding
patients or at least interest
39
00:01:36,885 --> 00:01:39,125
will dry up with
poor unit economics.
40
00:01:39,125 --> 00:01:43,600
That being said, you can't control your
age or your MRR with the flick of a switch.
41
00:01:43,600 --> 00:01:46,080
You do have significant
influence over your ARPU
42
00:01:46,080 --> 00:01:48,240
though, and particularly
your pricing.
43
00:01:48,240 --> 00:01:51,625
And it may be time to revisit that
pricing to control your churn.
44
00:01:51,625 --> 00:01:54,425
Those companies with lower
ARPUs see much higher churn
45
00:01:54,425 --> 00:01:56,345
than those with larger ARPU.
46
00:01:56,345 --> 00:02:00,090
If your average revenue per user per
month is below a hundred dollars,
47
00:02:00,090 --> 00:02:02,490
you're likely seeing monthly
gross dollar churn rates
48
00:02:02,490 --> 00:02:05,450
between three and sixteen
percent with a median between
49
00:02:05,450 --> 00:02:06,890
six and nine percent.
50
00:02:06,890 --> 00:02:08,415
That's a lot of churn.
51
00:02:08,415 --> 00:02:11,855
Yet ARPUs over five hundred
dollars see significantly lower
52
00:02:11,855 --> 00:02:14,815
revenue churn rates with a
range of roughly two to six
53
00:02:14,815 --> 00:02:18,080
percent and a median closer
to three and four percent.
54
00:02:18,080 --> 00:02:21,440
Of course, this is intuitive as
those higher ARPUs tend to come with
55
00:02:21,440 --> 00:02:24,080
more hand holding annual
contracts and a deeper
56
00:02:24,080 --> 00:02:25,865
relationship with your customer,
57
00:02:25,865 --> 00:02:29,145
that which is afforded through
higher revenues per user.
58
00:02:29,145 --> 00:02:29,865
Ultimately though,
59
00:02:29,865 --> 00:02:32,105
you need to pick your poison
when it comes to the company
60
00:02:32,105 --> 00:02:34,610
that you're trying to build
and the implications those
61
00:02:34,610 --> 00:02:36,290
decisions have on churn.
62
00:02:36,290 --> 00:02:39,090
Less churn is always
more success though,
63
00:02:39,090 --> 00:02:41,490
and you should be fighting to
reduce your churn as much as
64
00:02:41,490 --> 00:02:42,855
humanly possible.
65
00:02:42,855 --> 00:02:44,055
Ship us a question
on that front,
66
00:02:44,055 --> 00:02:46,935
and we'll show you the data
to tell you actually how.
67
00:02:46,935 --> 00:02:48,135
Well, that's all for now.
68
00:02:48,135 --> 00:02:49,015
If you have a question,
69
00:02:49,015 --> 00:02:51,930
shoot me an email or video
to p c at profitable dot com.
70
00:02:51,930 --> 00:02:54,090
Let's also thank Abe
from Feather for sparking this
71
00:02:54,090 --> 00:02:56,250
research by clicking on the
link below to give him a nice
72
00:02:56,250 --> 00:02:57,130
little shout out.
73
00:02:57,130 --> 00:02:58,950
We'll see you next week.