
NPS Revenue Correlation: Impact of NPS on Revenue Expansion
This episode might reference ProfitWell and ProfitWell Recur, which following the acquisition by Paddle is now Paddle Studios. Some information may be out of date.
Originally published: July 25th, 2018
Customer satisfaction isn’t everything, but it’s hard to imagine a successful business that doesn’t take customer sentiment into strong consideration. That being said, the cult following around customer satisfaction utilizing Net Promoter Score or NPS is admirable, but as we’ll see in the data, NPS is not infallible.
But first, if you like this kind of content and want to learn more, subscribe to get in the know when we release new episodes.

NPS Doesn't Predict Retention Accurately
As to not bury the lede, NPS, as an aggregate measure of customer satisfaction, is not a strong indicator of retention. I know that's going to be shocking to the NPS acolytes out there, but when we look at the data, you'll notice that those companies who have an NPS score in the lower quartile or in the midspread of their industry have essentially the same retention with mild acceptable variations here and there.
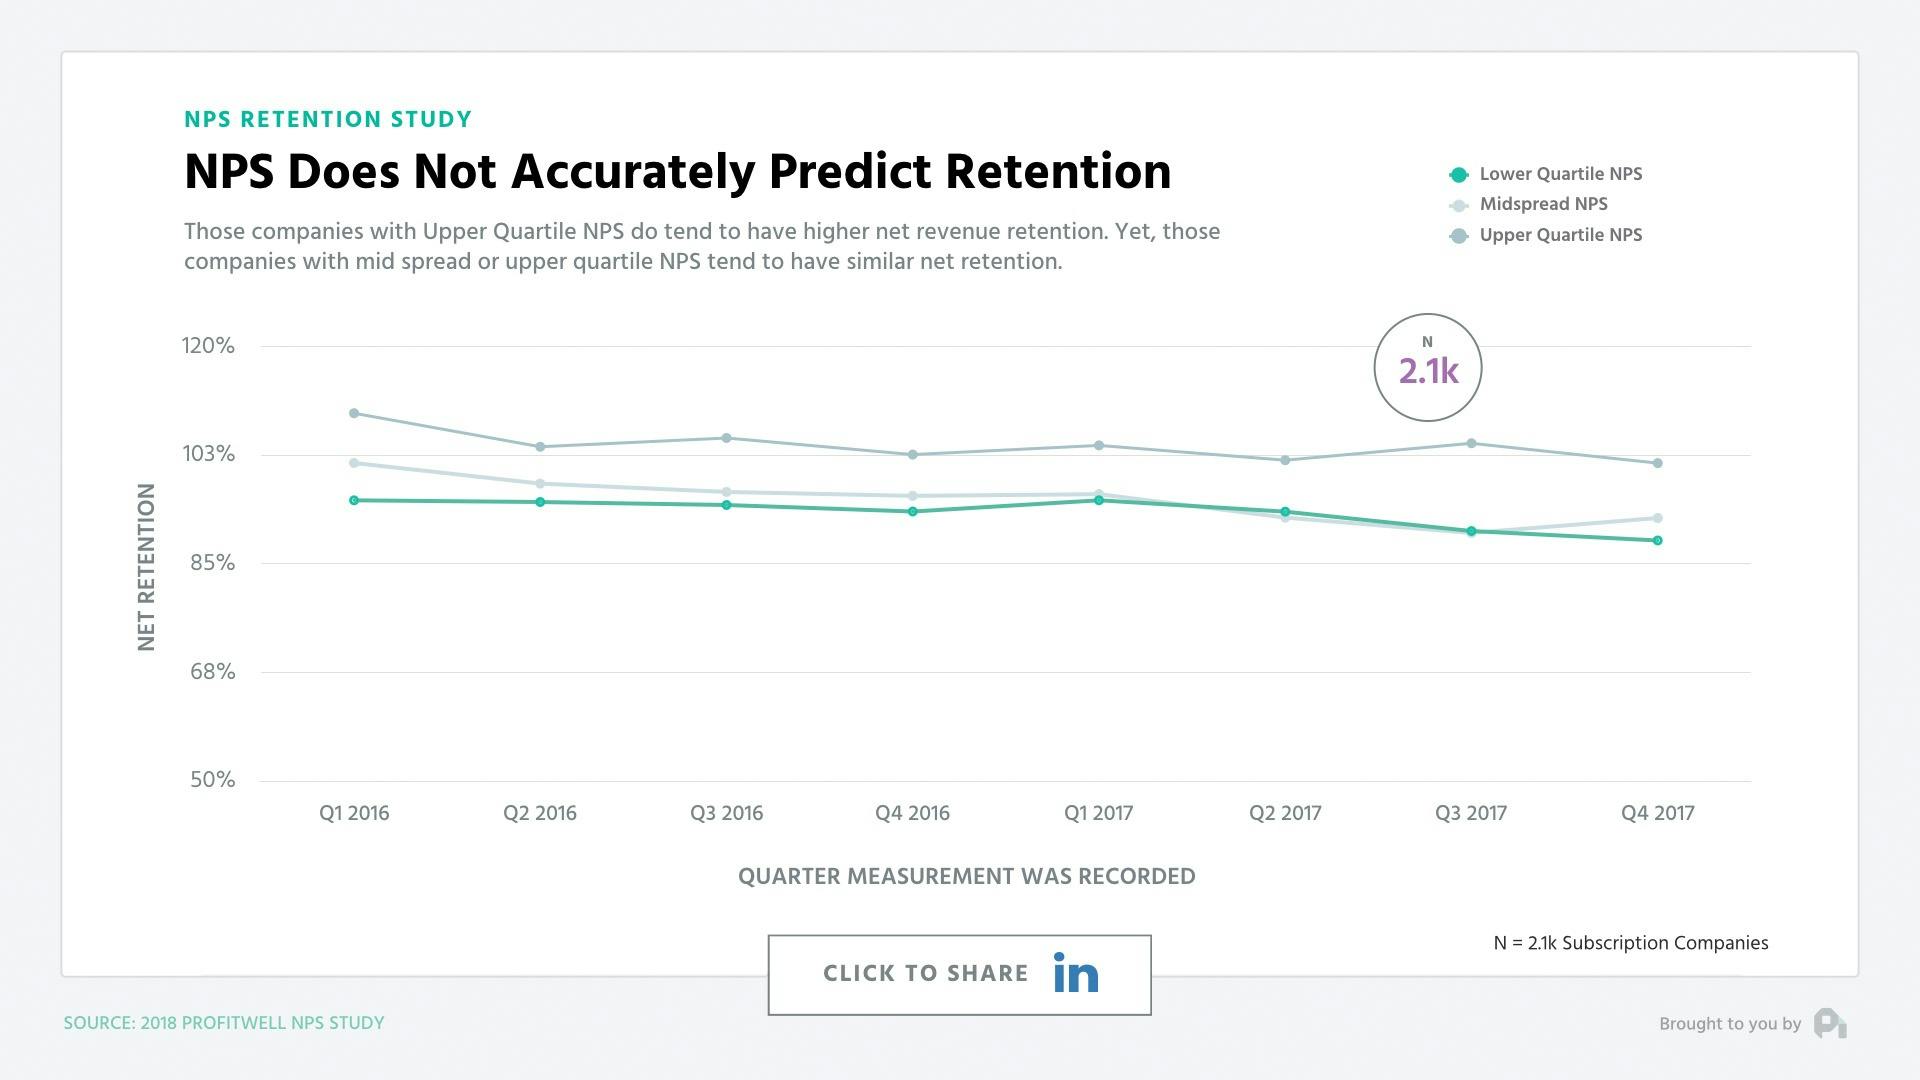
We broke out the striations of NPS across the spectrum and consistently the only indicator of any strong correlation in one direction or another is if your NPS was in the upper quartile of your industry. You then tended to have 5 to 10% higher retention on an absolute basis.
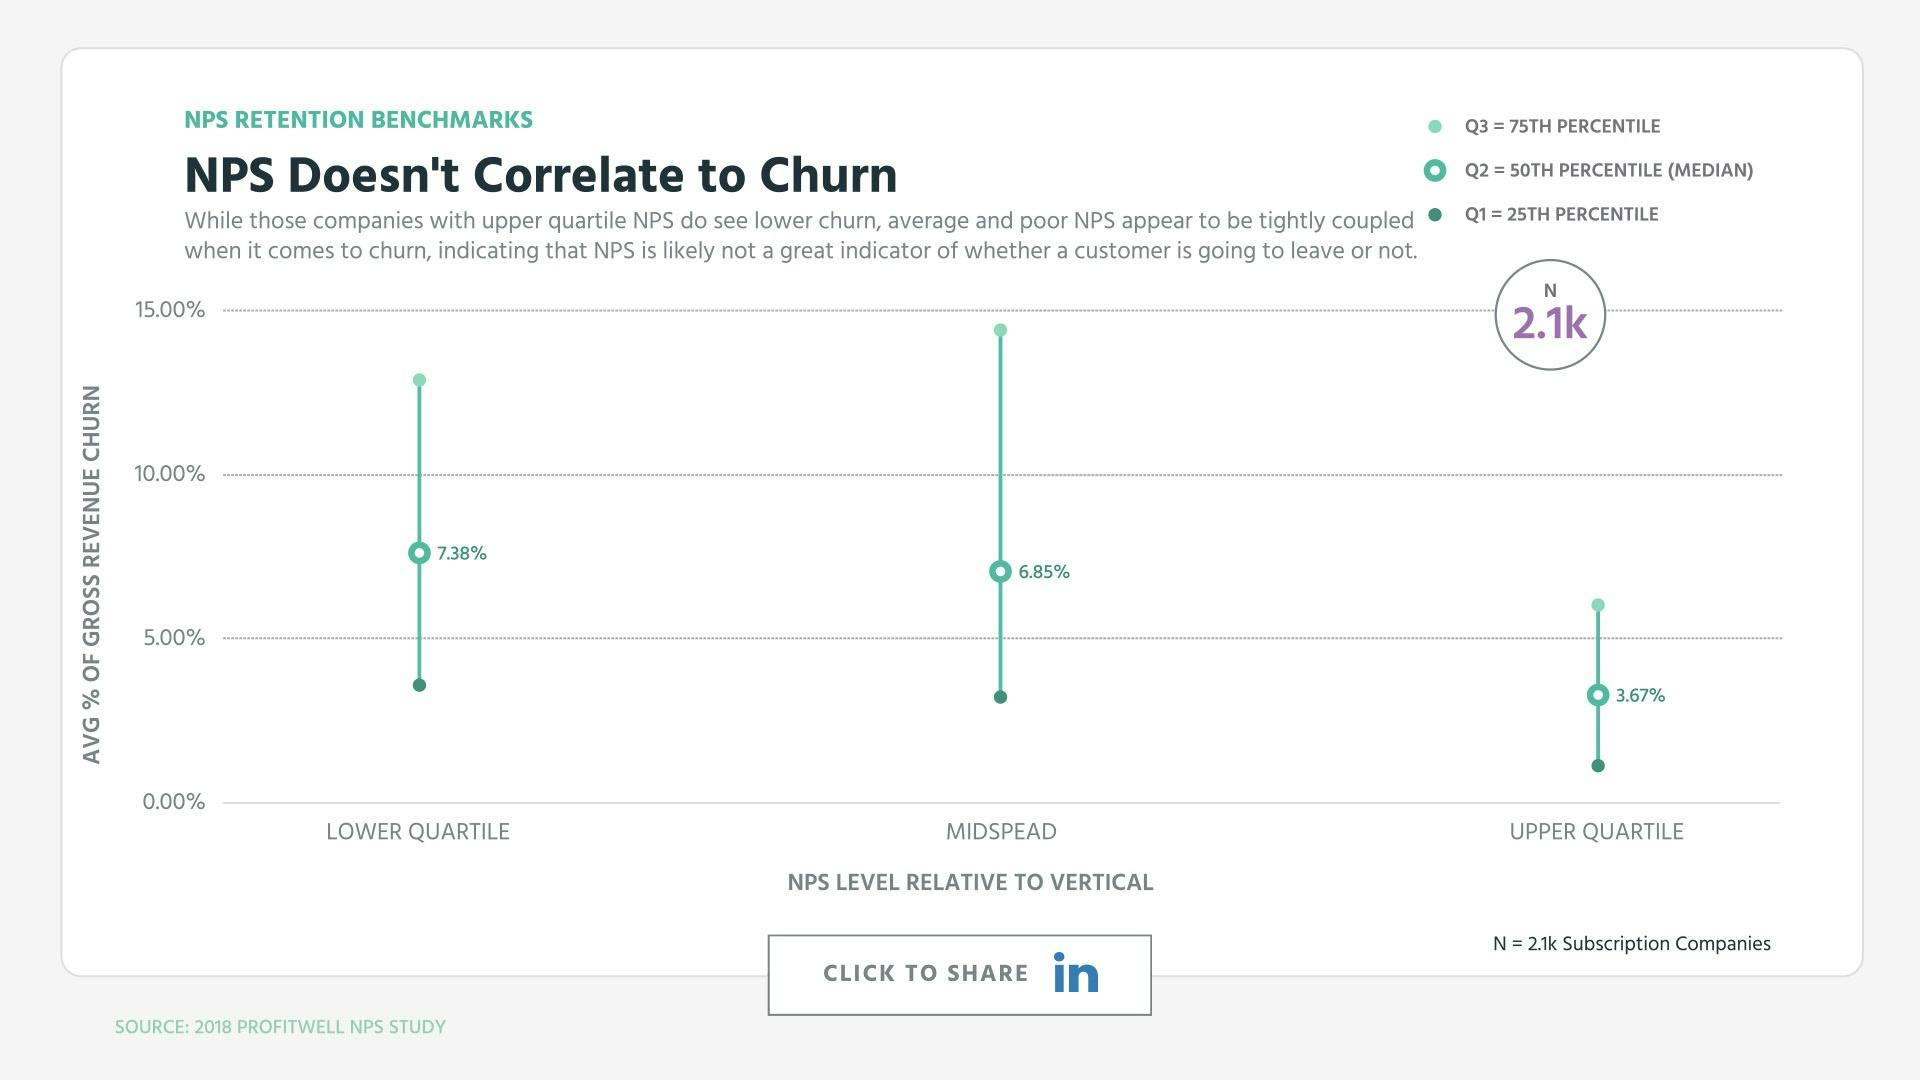
NPS And Churn Rarely Correlate
Note that this trend is also consistent when you look at gross churn rate, where upper quartile NPS companies have noticeably lower churn, but median and bad NPS companies are essentially the same.
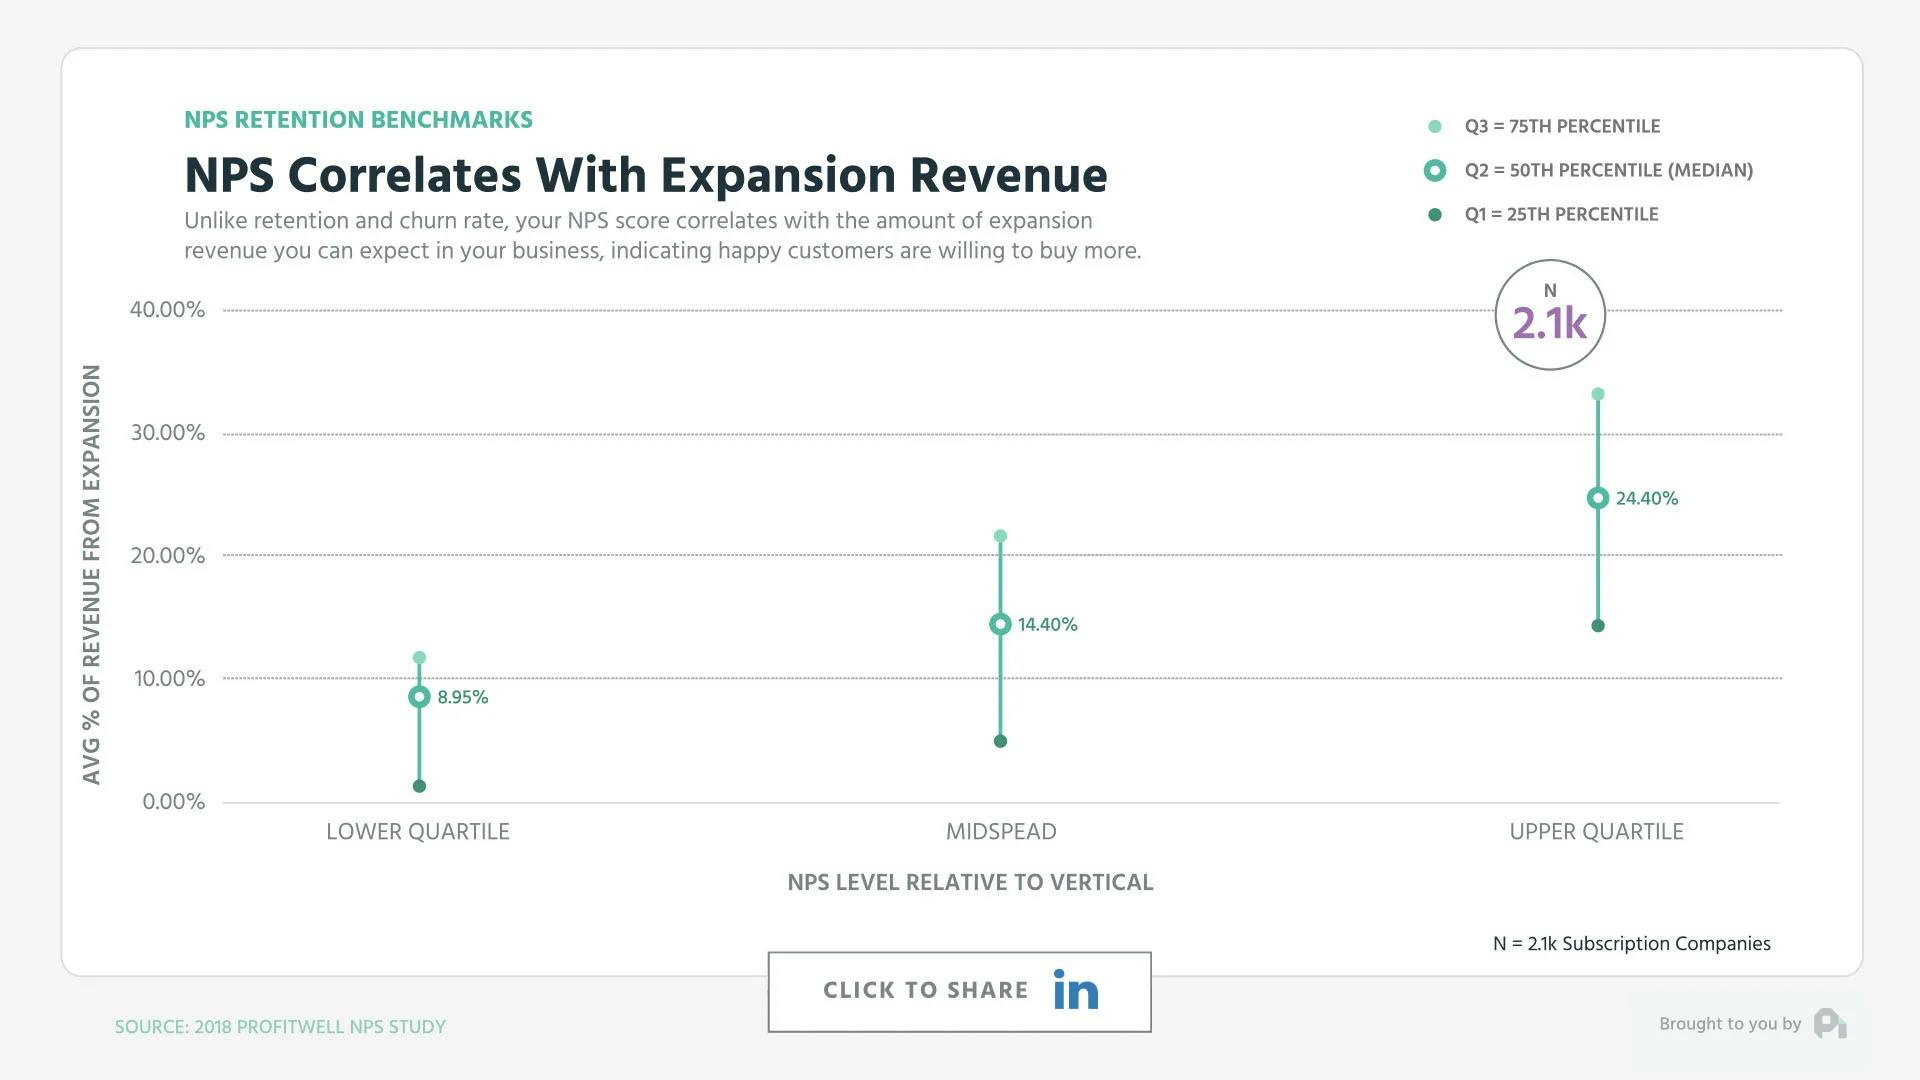
NPS Correlates With Expansion Revenue
Things get interesting though when looking at expansion revenue, where as a company has higher NPS there is a stronger correlation to having more expansion revenue with lower quartile NPS companies seeing a median of 9% monthly revenue coming from expansion, the midspread seeing 14% and the upper quartile 24%.
So what does this mean for NPS?
Well, it means that in aggregate NPS is very much a reactionary metric that lacks enough sensitivity to be useful as a measure of momentum. If you have high NPS, it’s great, but there’s likely a lot of lurking variables that contribute to your retention that NPS is simply measuring. This also means that if you have above average NPS it doesn’t necessarily mean you’re better off than a company with bad NPS, which is unsettling for our industries obsession with such an insensitive metric.
NPS is still useful, but likely only as a framework for identifying those customers on an individual basis who are raising their hands in frustration and as a blunt metric that when looked at in aggregate or on a segmented basis you want going up over time. Put another way, collect NPS, but your actual financial and retention metrics are an order of magnitude more important.
That's all for this week. Want to learn more? Check out our latest episode on MultiProduct vs. Single Product Strategies and subscribe to the show to get new episodes.
1
00:00:00,320 --> 00:00:03,520
You've got the questions,
and we have the data.
2
00:00:03,520 --> 00:00:06,620
This is the ProfitWell Report.
3
00:00:09,315 --> 00:00:10,115
Hey, Patrick.
4
00:00:10,115 --> 00:00:13,695
What's the relationship
between NPS and retention?
5
00:00:13,715 --> 00:00:16,220
Customer satisfaction
isn't everything,
6
00:00:16,220 --> 00:00:18,620
but it's hard to imagine
a successful business that
7
00:00:18,620 --> 00:00:21,960
doesn't take customer sentiment
into strong consideration.
8
00:00:21,980 --> 00:00:25,765
That being said, the cult following
around customer satisfaction utilizing
9
00:00:25,765 --> 00:00:28,565
Net Promoter Score
or NPS is admirable,
10
00:00:28,565 --> 00:00:32,360
but as we'll see in the
data, NPS is not infallible.
11
00:00:32,360 --> 00:00:33,720
To answer Chirag's question,
12
00:00:33,720 --> 00:00:36,760
we looked at the data from two
thousand companies and over ten
13
00:00:36,760 --> 00:00:39,060
thousand subscription consumers.
14
00:00:39,160 --> 00:00:40,600
As to not bury the lead,
15
00:00:40,600 --> 00:00:44,645
NPS as an aggregate measure
of customer satisfaction is not a
16
00:00:44,645 --> 00:00:46,565
strong indicator of retention.
17
00:00:46,565 --> 00:00:49,560
I know that's gonna be shocking
to some of the NPS acolytes out
18
00:00:49,560 --> 00:00:51,160
there, but when we
look at the data,
19
00:00:51,160 --> 00:00:53,720
you'll notice that those
companies who have an NPS score
20
00:00:53,720 --> 00:00:56,925
in the lower quartile or in the
mid spread of their industry
21
00:00:56,925 --> 00:01:01,965
have essentially the same retention
with mild variations here and there.
22
00:01:01,965 --> 00:01:05,880
We broke out the striations
of NPS across the spectrum and
23
00:01:05,880 --> 00:01:09,320
consistently the only indicator
of any strong correlation in
24
00:01:09,320 --> 00:01:12,440
one direction or another is
if your NPS was in the upper
25
00:01:12,440 --> 00:01:14,255
quartile of your industry.
26
00:01:14,255 --> 00:01:17,775
You then tended to have five
to ten percent higher retention on
27
00:01:17,775 --> 00:01:19,375
an absolute basis.
28
00:01:19,375 --> 00:01:22,560
Note that this trend is also
consistent when you look at
29
00:01:22,560 --> 00:01:25,920
gross churn rate where upper
quartile NPS companies have
30
00:01:25,920 --> 00:01:29,680
noticeably lower churn, but
median and bad NPS companies
31
00:01:29,680 --> 00:01:31,695
are essentially the same.
32
00:01:31,695 --> 00:01:34,735
Things get interesting though
when looking at expansion revenue.
33
00:01:34,735 --> 00:01:37,295
Whereas a company, if
you have higher NPS,
34
00:01:37,295 --> 00:01:41,010
there's a stronger correlation
to more expansion revenue where
35
00:01:41,010 --> 00:01:44,370
lower quartile NPS companies
are seeing a median of nine
36
00:01:44,370 --> 00:01:48,175
percent monthly expansion where
mid spread see fourteen percent
37
00:01:48,175 --> 00:01:50,575
and upper quartile
see twenty four.
38
00:01:50,575 --> 00:01:52,255
So what does this mean then?
39
00:01:52,255 --> 00:01:53,935
Well, it means
that in aggregate,
40
00:01:53,935 --> 00:01:57,770
NPS is very much a reactionary
metric that lacks enough
41
00:01:57,770 --> 00:02:00,490
sensitivity to be useful
as a measure of momentum.
42
00:02:00,490 --> 00:02:02,010
If you have high
NPS, it's great,
43
00:02:02,010 --> 00:02:04,250
but there's probably a lot
of lurking variables that
44
00:02:04,250 --> 00:02:06,255
contribute to your
high retention.
45
00:02:06,255 --> 00:02:08,895
This also means that if
you have above average NPS,
46
00:02:08,895 --> 00:02:11,295
it doesn't necessarily mean
that you're better off than
47
00:02:11,295 --> 00:02:16,000
those who have bad NPS
which is unsettling given our industry's
48
00:02:16,000 --> 00:02:18,640
obsession with such
an insensitive metric.
49
00:02:18,640 --> 00:02:22,640
NPS is still useful just
likely only as a framework for
50
00:02:22,640 --> 00:02:25,975
identifying those customers on an
an individual basis who are
51
00:02:25,975 --> 00:02:29,015
having problems and raising
their hands and frustration.
52
00:02:29,015 --> 00:02:32,135
And a blunt metric that when
used in aggregate or on a
53
00:02:32,135 --> 00:02:35,620
segmented basis really means
that you wanna be moving up
54
00:02:35,620 --> 00:02:38,180
into the right with
this metric over time.
55
00:02:38,180 --> 00:02:40,500
Put another way, collect NPS,
56
00:02:40,500 --> 00:02:44,185
but your actual financial and
retention metrics are an order
57
00:02:44,185 --> 00:02:46,485
of magnitude more important.
58
00:02:46,505 --> 00:02:47,625
Well, that's all for now.
59
00:02:47,625 --> 00:02:48,665
If you have a question,
60
00:02:48,665 --> 00:02:51,800
shoot me an email or video to
p c at profit well dot com.
61
00:02:51,800 --> 00:02:54,760
And let's also thank Shirod
from Datorama for sparking this
62
00:02:54,760 --> 00:02:58,965
research by clicking the link below to
share and give him a good shout out.
63
00:02:58,965 --> 00:03:00,545
We'll see you next
64
00:03:00,965 --> 00:03:02,065
week.
65
00:03:02,485 --> 00:03:04,645
This week's episode is
brought to you by Later.
66
00:03:04,645 --> 00:03:09,379
Visually plan and schedule
Instagram posts. Later dot com.