
Ideal Customer Target Size for a New SaaS Company
This episode might reference ProfitWell and ProfitWell Recur, which following the acquisition by Paddle is now Paddle Studios. Some information may be out of date.
Originally published: May 9th, 2018
There are many factors that go into which company size is an ideal target for SaaS companies. As the data suggests, there are different trade-offs when it comes to looking at potential retention rates, CAC (customer acquisition cost), and willingness to pay across the different market segments of SMB, Mid-Market, and Enterprise sized companies.
On this episode of the ProfitWell Report, Matt Smith, Founder of Later, asks Patrick a tough one: Which size company would he target as customers if he were to start a new company? To answer his question, let’s look at the data and unit economics from just over 5,000 companies and the willingness to pay for 1.2M subscription consumers.
But first, if you like this kind of content and want to learn more, subscribe to get in the know when we release new episodes.

Higher ARPU Companies Have a Retention Advantage
There are a lot of vectors to consider here, but let’s assume we’re taking the baseline of building a business - acquiring a customer, keeping them around, and monetizing them accordingly. On the revenue retention front, larger ARPU (average revenue per user) companies have an advantage.
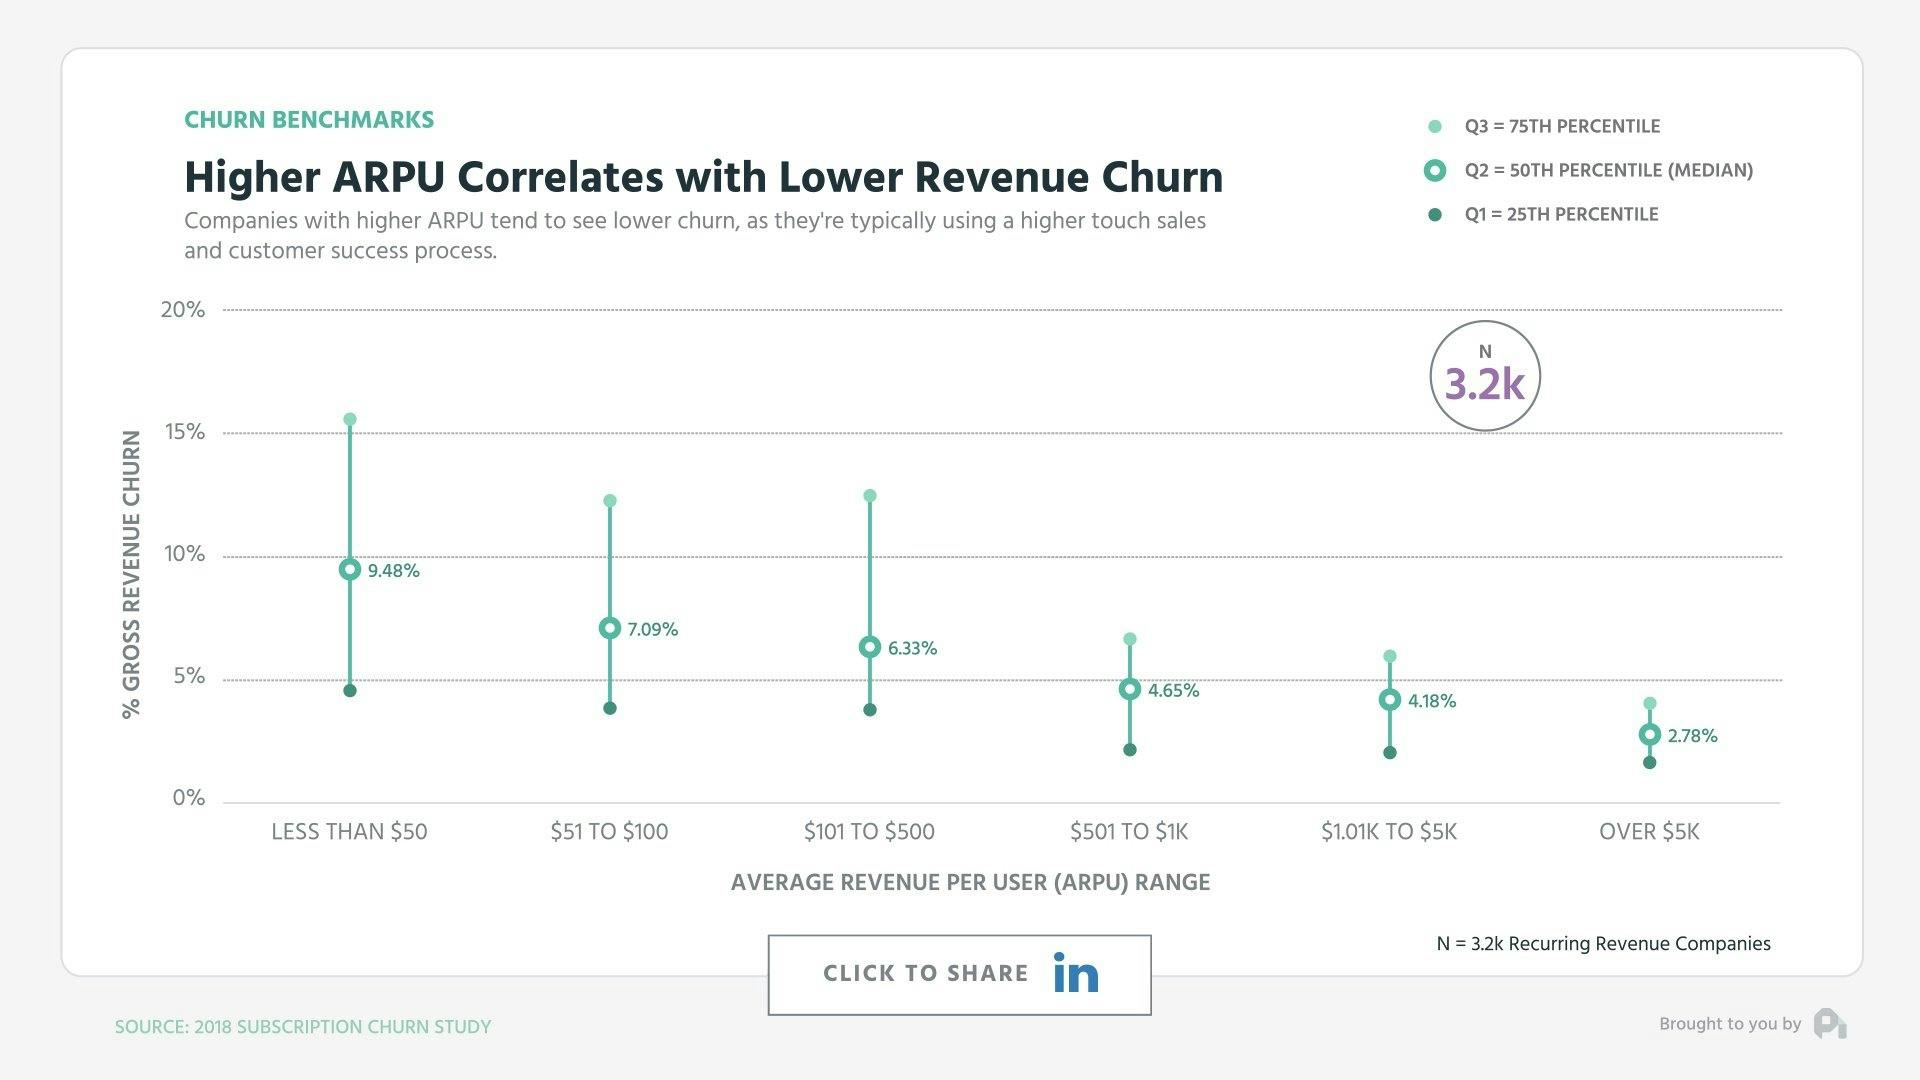
As a company’s ARPU increases - correlating with becoming more Enterprise - gross revenue retention reduces dramatically. Sub $100 products see revenue churn at 7 to 9% which balloons in comparison to the median of nearly 3% gross revenue churn for those getting into five thousand dollar plus ARPU.
CAC is rising across the board, but especially for SMB
Beyond retention, acquisition is a really big factor here, so we need to consider CAC, and here’s where things get really interesting.
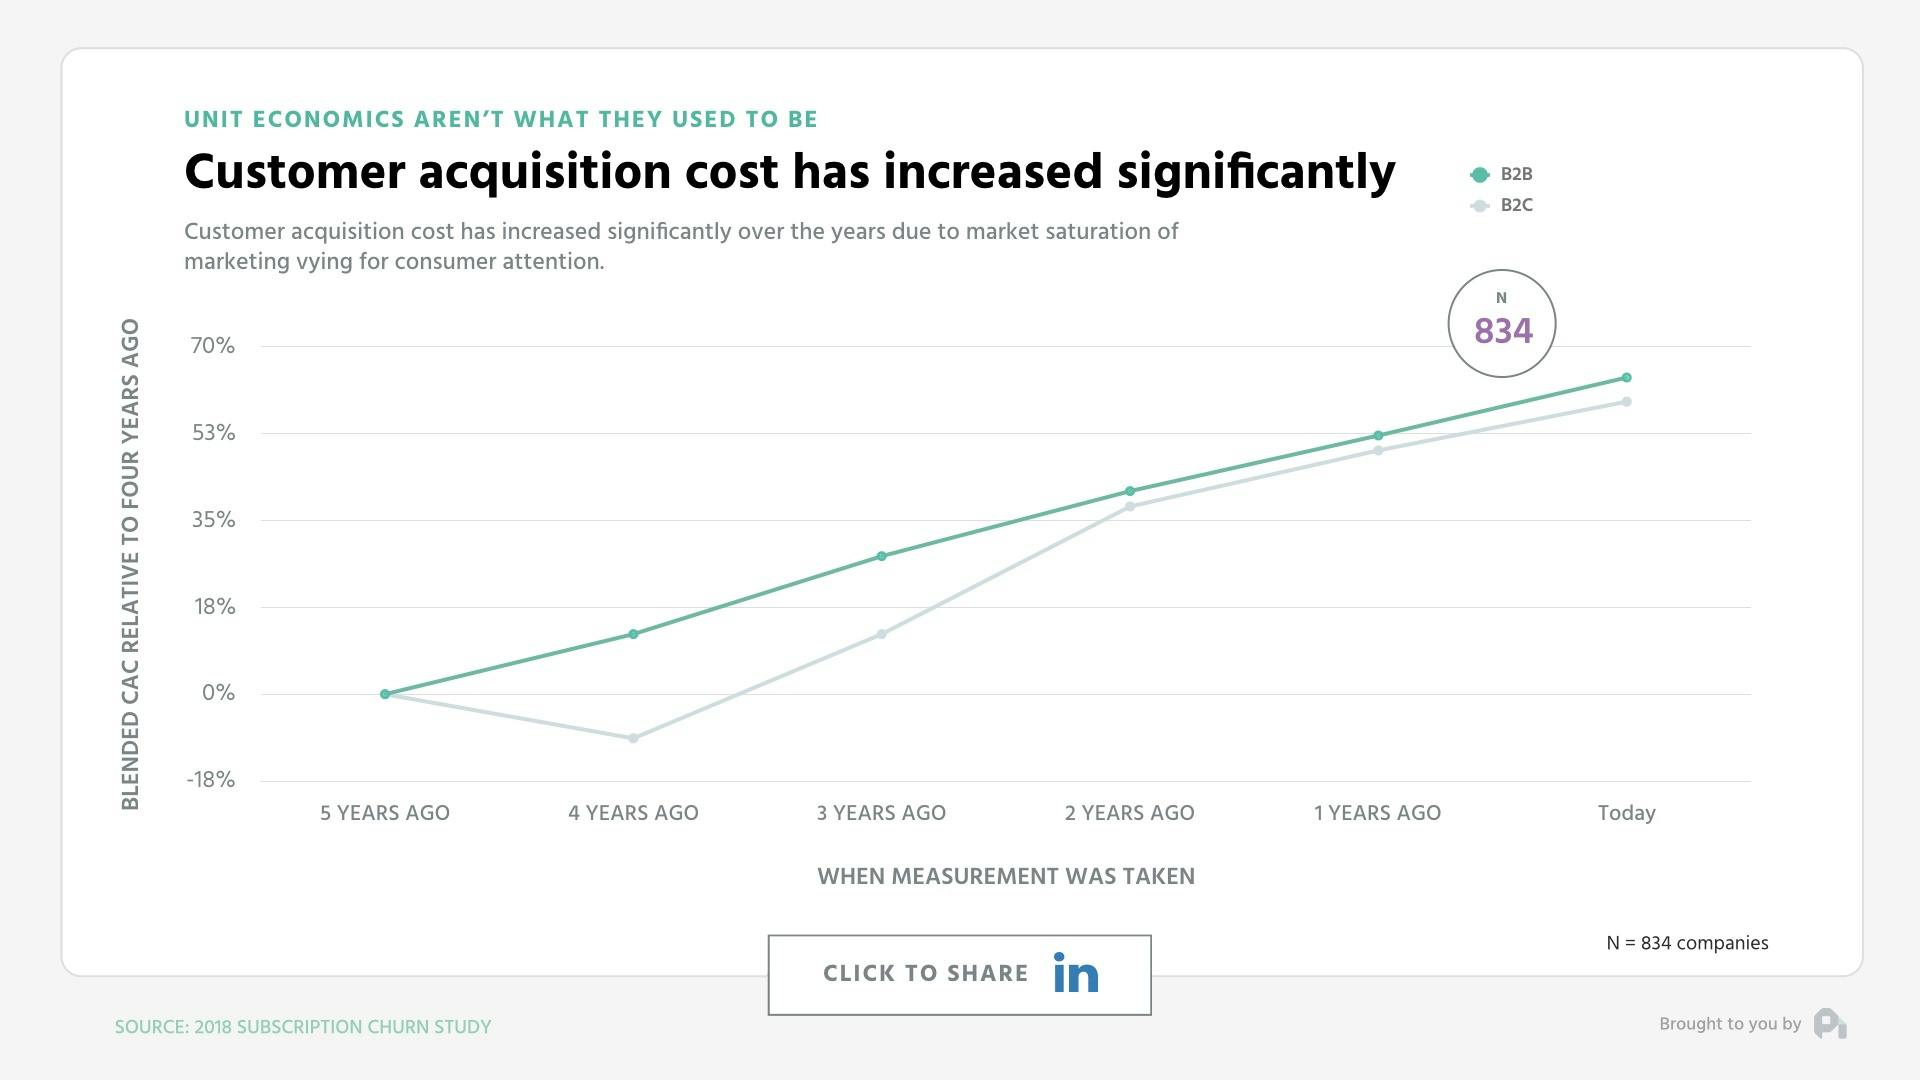
CAC has increased substantially with both B2B and B2C seeing 55 to 65% higher than five years ago overall. Yet, the story unfolds very differently when you look at our three sized categories.
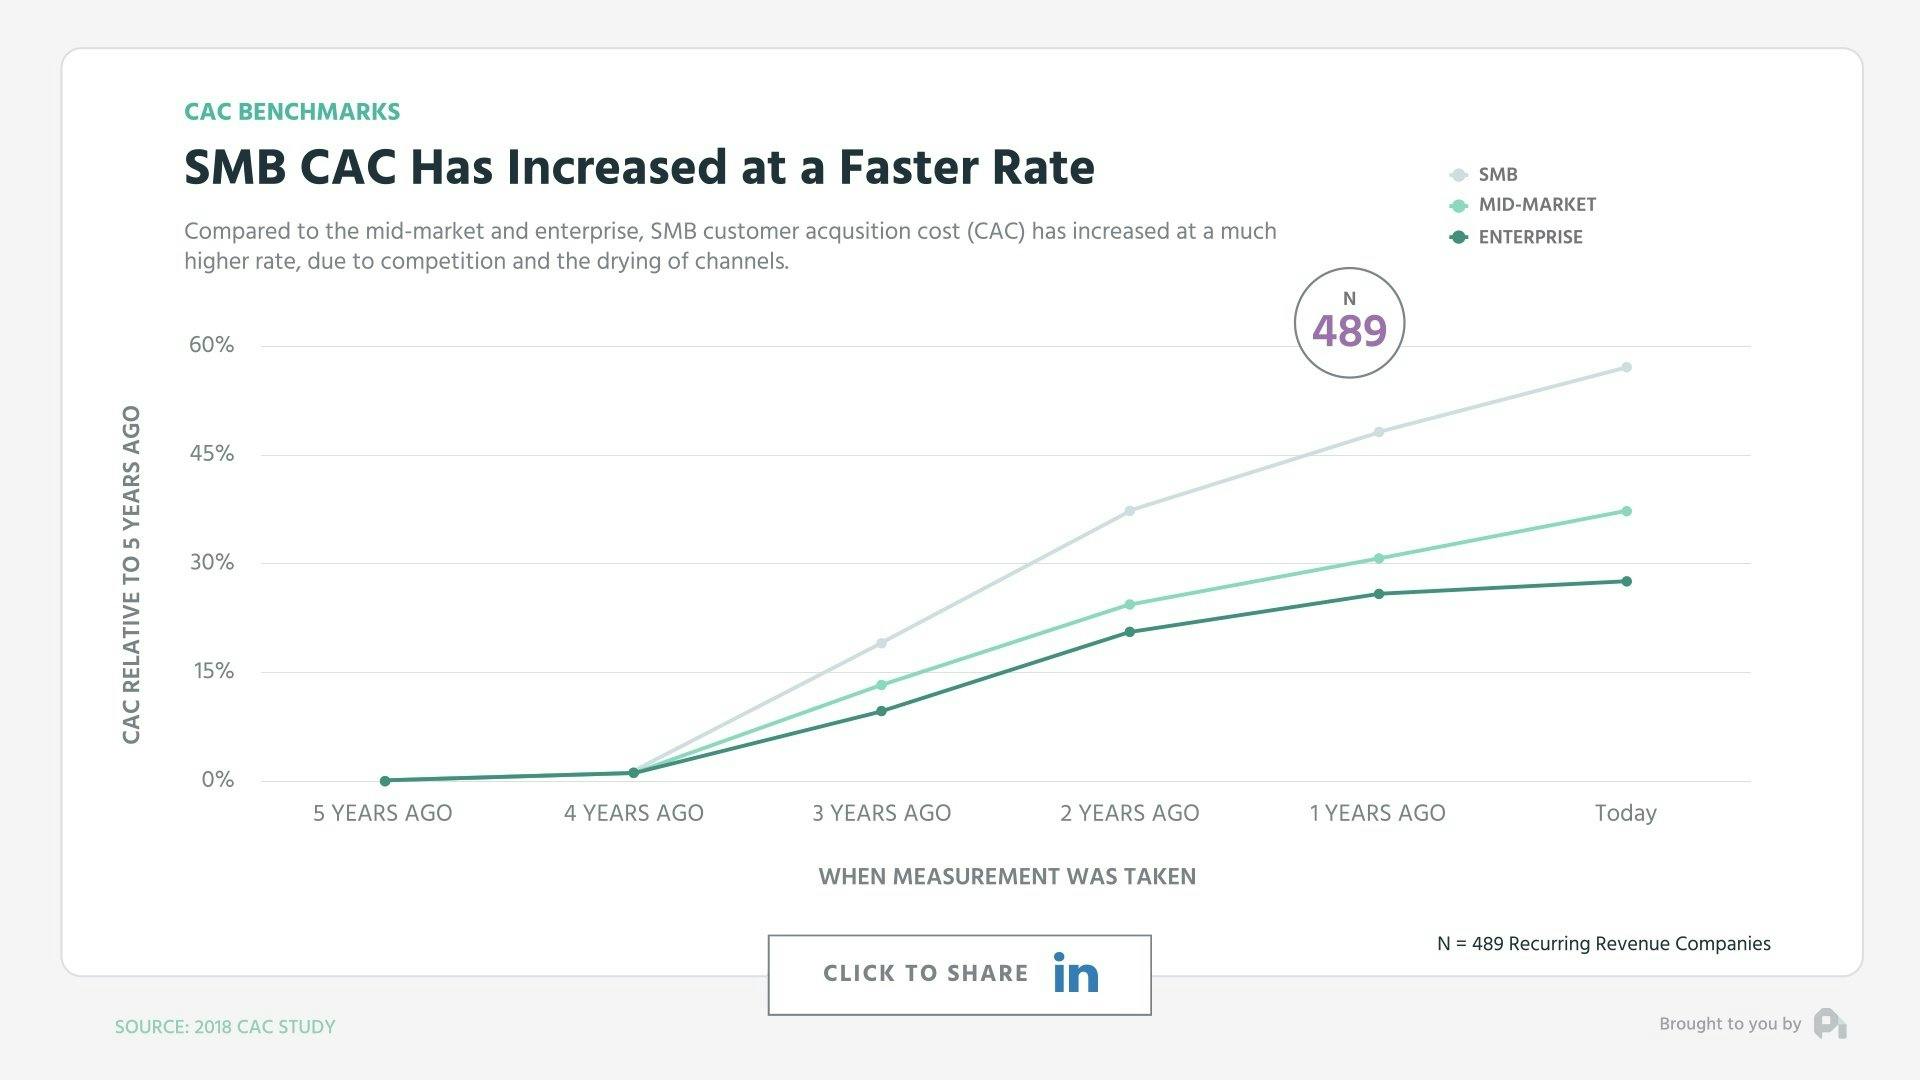
On a relative basis, SMB CAC has grown at a far quicker and higher rate than CAC in the mid-market and enterprise. While maybe not immediately intuitive, the big reason this has happened really centers around the fact that mid-market and enterprise CAC has always been high and there’s been gains in some efficiency with these types of sales processes over the years.
SMB and Mid-Market WTP has increased
Our third vector though around willingness to pay is where things get tricky. Interestingly enough, SMB and mid-market willingness to pay has actually increased in the aggregate while enterprise willingness to pay has decreased over time.
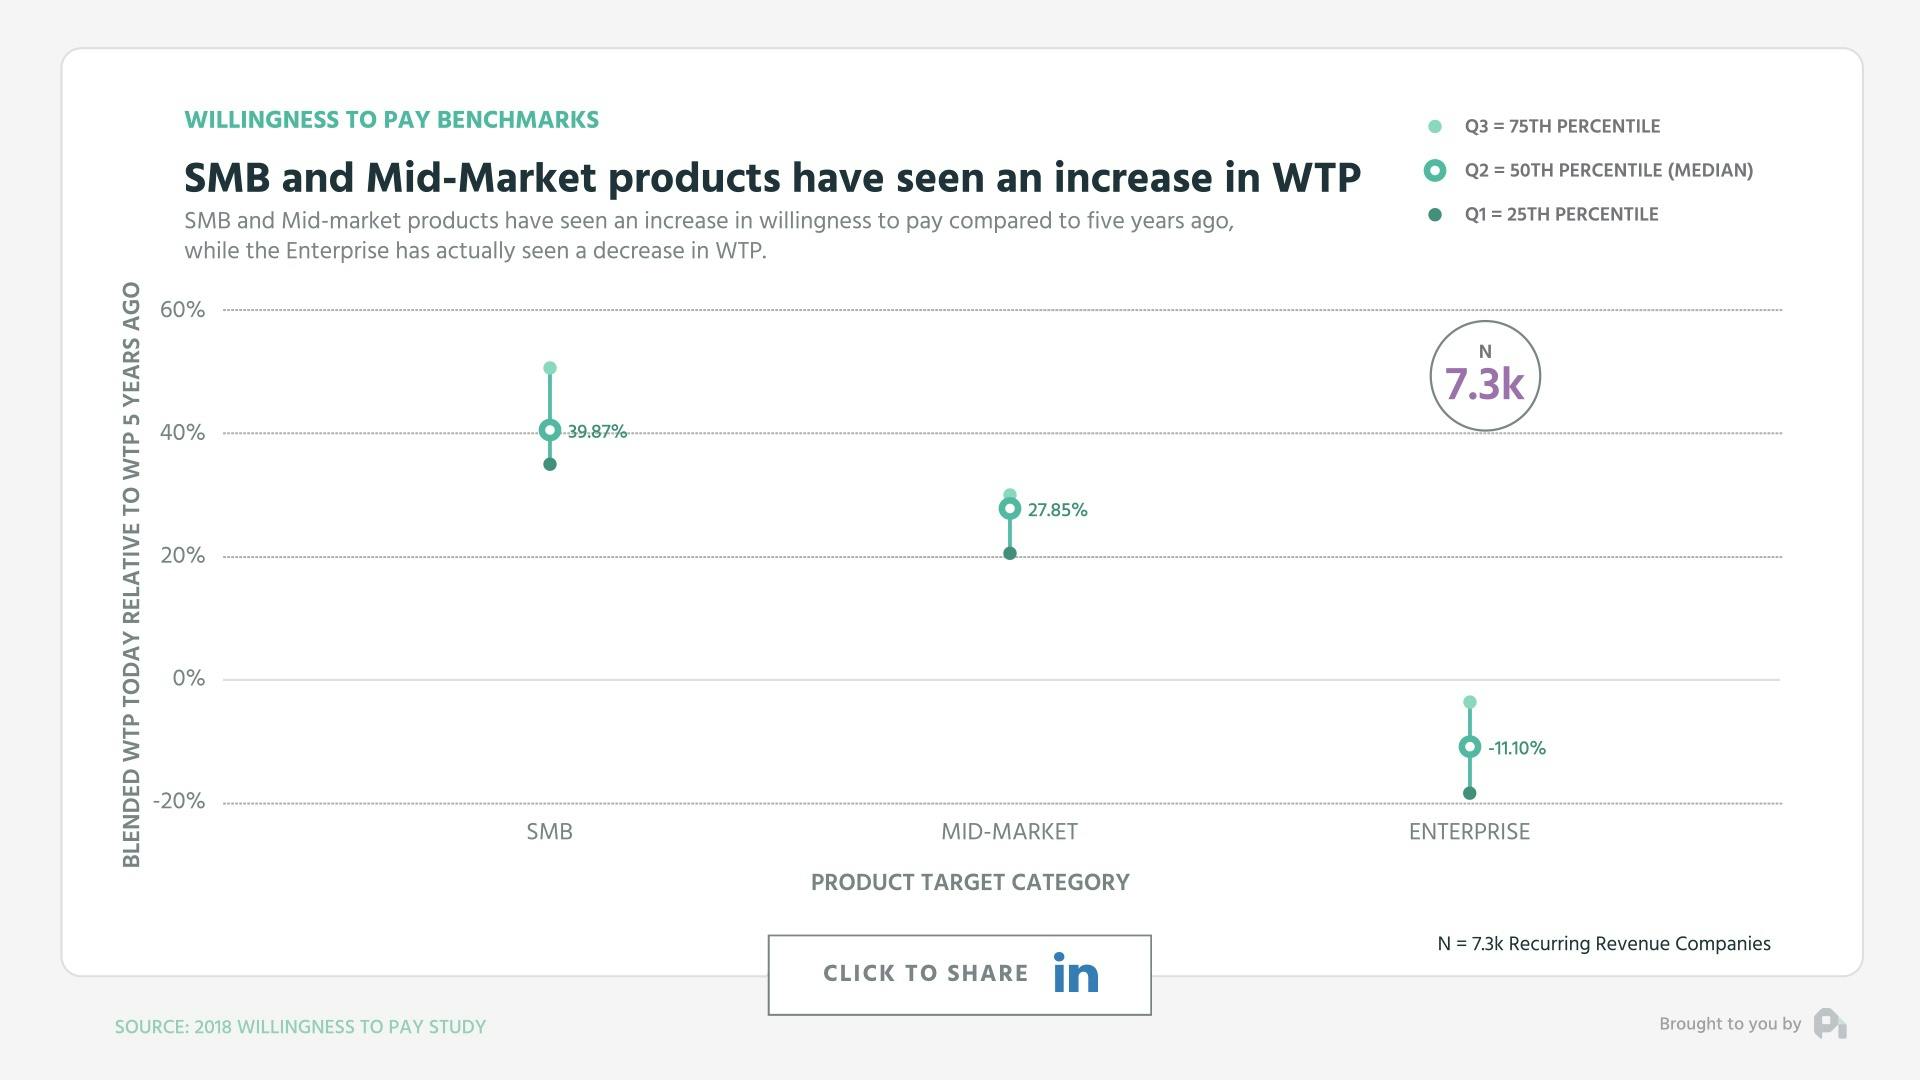
Compared to five years ago, the median willingness to pay for an SMB buyer has actually increased by 35 to 50%. Mid-market shows a similar path with an increase of 20 to 30%, but Enterprise has actually decreased by just over 10%.
Keep in mind that we’re blending B2B and B2C here and happy to go deeper there if you send us a question to, but the trend stands to reason considering the technical and information asymmetry moats we once enjoyed in the enterprise don’t exist as much as they used to.
So what should we do? Well, controlling for market size, which is expanding on all fronts, I believe the answer still comes down to the DNA of you and your company. No particular trend indicated there was a gold rush of opportunity and similarly no trend indicated you should be running for the hills. Instead, the trends indicated in context of one another it’s getting harder for everyone out there, so now more than ever you need to specialize and utilize your frameworks and data to grow as effectively as possible.
Want to learn more? Check out our recent episode: Price Tier Anchoring Benchmarks and subscribe to the show to get new episodes.

1
00:00:00,320 --> 00:00:03,440
You've got the questions,
and we have the data.
2
00:00:03,440 --> 00:00:06,620
This is the ProfitWell Report.
3
00:00:09,295 --> 00:00:11,695
Hey, Patrick. Matt
from Later here.
4
00:00:11,695 --> 00:00:13,375
If you're gonna start
a company tomorrow,
5
00:00:13,375 --> 00:00:16,415
would you go into SMB,
mid market, or enterprise?
6
00:00:16,415 --> 00:00:17,515
Thanks.
7
00:00:17,520 --> 00:00:20,320
This is a terribly difficult
question because there's so
8
00:00:20,320 --> 00:00:21,920
many axes to consider.
9
00:00:21,920 --> 00:00:23,280
Thanks for a toughie, Matt.
10
00:00:23,280 --> 00:00:24,480
But to answer your question,
11
00:00:24,480 --> 00:00:27,235
we looked at the unit economics
of just over five thousand
12
00:00:27,235 --> 00:00:29,555
companies and the willingness
to pay for one point two
13
00:00:29,555 --> 00:00:32,675
million subscription consumers,
and here's what we found.
14
00:00:32,675 --> 00:00:34,515
There's a lot of vectors
here to consider,
15
00:00:34,515 --> 00:00:37,050
but let's assume we're taking
the baseline of building a
16
00:00:37,050 --> 00:00:39,930
business, acquiring a
customer, keeping them around,
17
00:00:39,930 --> 00:00:41,905
and monetizing them accordingly.
18
00:00:41,905 --> 00:00:43,345
On the revenue retention front,
19
00:00:43,345 --> 00:00:45,505
larger ARPU companies
have an advantage.
20
00:00:45,505 --> 00:00:47,345
As a company's ARPU increases,
21
00:00:47,345 --> 00:00:49,585
correlating with
becoming more enterprise,
22
00:00:49,585 --> 00:00:51,780
gross revenue retention
reduces dramatically.
23
00:00:51,780 --> 00:00:54,144
For those
24
00:00:54,308 --> 00:00:56,672
getting five
25
00:00:56,836 --> 00:00:59,520
thousand dollar plus ARPU.
26
00:00:59,855 --> 00:01:00,435
Beyond retention,
27
00:01:00,435 --> 00:01:03,395
for those getting five
thousand dollar plus ARPU.
28
00:01:03,395 --> 00:01:06,435
Beyond retention, acquisition
is a really big factor here.
29
00:01:06,435 --> 00:01:07,940
So we need to consider CAC,
30
00:01:07,940 --> 00:01:10,660
and here's where things
get really interesting.
31
00:01:10,660 --> 00:01:13,860
CAC has increased substantially
with both b to b and b to c
32
00:01:13,860 --> 00:01:17,335
companies seeing fifty five to
sixty five percent higher CAC
33
00:01:17,335 --> 00:01:18,695
than five years ago.
34
00:01:18,695 --> 00:01:21,735
Yet, the story unfolds very
differently when you look at
35
00:01:21,735 --> 00:01:23,440
our three size categories.
36
00:01:23,440 --> 00:01:24,640
On a relative basis,
37
00:01:24,640 --> 00:01:28,160
SMB CAC has grown at a far
quicker and higher rate than
38
00:01:28,160 --> 00:01:30,615
CAC in the mid market
and enterprise.
39
00:01:30,615 --> 00:01:32,695
Well, maybe not
immediately intuitive.
40
00:01:32,695 --> 00:01:35,495
The big reason this has
happened really centers around
41
00:01:35,495 --> 00:01:38,935
the fact that mid market and
enterprise CAC has always been high,
42
00:01:38,935 --> 00:01:41,770
and there's been gain in some
efficiency with these types of
43
00:01:41,770 --> 00:01:44,010
sales processes over the years.
44
00:01:44,010 --> 00:01:46,490
Our third vector around
willingness to pay is where
45
00:01:46,490 --> 00:01:48,415
things get a little bit tricky.
46
00:01:48,415 --> 00:01:49,295
Interestingly enough,
47
00:01:49,295 --> 00:01:53,135
SMB and mid market willingness to pay
has actually increased in aggregate,
48
00:01:53,135 --> 00:01:56,550
while enterprise willingness
to pay has decreased over time.
49
00:01:56,550 --> 00:01:57,590
Compared to five years ago,
50
00:01:57,590 --> 00:02:00,710
the median willingness to pay
for an SME buyer was actually
51
00:02:00,710 --> 00:02:03,270
increasing by thirty
five to fifty percent.
52
00:02:03,270 --> 00:02:06,125
Mid market shows a similar path
with an increase of twenty to
53
00:02:06,125 --> 00:02:08,525
thirty percent, but on
the enterprise basis,
54
00:02:08,525 --> 00:02:11,005
it's actually reduced
by ten percent.
55
00:02:11,005 --> 00:02:13,805
Keep in mind, we're blending
b to b and b to c here,
56
00:02:13,805 --> 00:02:17,070
and we're happy to go deeper
there if you send us a question,
57
00:02:17,070 --> 00:02:20,190
but the trend stands to reason
considering the technical and
58
00:02:20,190 --> 00:02:24,265
information asymmetry modes we
once enjoyed in the enterprise
59
00:02:24,265 --> 00:02:26,505
don't really exist as
much as they used to.
60
00:02:26,505 --> 00:02:27,945
So what should you do?
61
00:02:27,945 --> 00:02:29,865
Well, controlling
for market size,
62
00:02:29,865 --> 00:02:32,220
which is expanding
on all fronts,
63
00:02:32,220 --> 00:02:35,500
I believe the answer still
comes down to the DNA of the
64
00:02:35,500 --> 00:02:38,140
company that you're
seeking and yourself.
65
00:02:38,140 --> 00:02:40,215
No particular trend it's
66
00:02:46,715 --> 00:02:47,595
getting harder for
everyone out there.
67
00:02:47,595 --> 00:02:47,728
So now more than ever,
68
00:02:47,728 --> 00:02:50,420
we need to it's getting
harder for everyone out there.
69
00:02:50,420 --> 00:02:51,460
So now more than ever,
70
00:02:51,460 --> 00:02:54,580
we need to specialize and
utilize the frameworks and data
71
00:02:54,580 --> 00:02:57,345
to grow as effectively
as possible.
72
00:02:57,345 --> 00:02:58,385
Well, that's all for now.
73
00:02:58,385 --> 00:02:59,265
If you have a question,
74
00:02:59,265 --> 00:03:02,145
shoot me an email or video to
p c at profit well dot com.
75
00:03:02,145 --> 00:03:04,305
And let's also thank Matt
from later for sparking this
76
00:03:04,305 --> 00:03:07,473
research by clicking the link below
to give him a nice little shout out.
77
00:03:07,473 --> 00:03:09,293
We'll see you next week.


