Having a predictive churn model can help you weed out delinquent and involuntary churn, keeping more customers and securing revenue.
Churn (aka customer attrition) is a scourge on subscription businesses. When your revenue is based on recurring monthly or annual contracts, every customer who leaves puts a dent in your cash flow. High retention rates are vital for your survival.
So what if we told you there was a way to predict, at least to some degree, how and when your customers will cancel?
That’s exactly what a churn model can do.
Building a predictive churn model helps you make proactive changes to your retention efforts that drive down churn rates. Understanding how churn impacts your current revenue goals and making predictions about how to manage those issues in the future also helps you stem the flow of churned customers. If you don’t take action against your churn now, any company growth you experience simply won’t be sustainable.
In the following article, we’ll talk through everything that goes into building your own churn prediction model and how to go about starting the process.
What is a churn model?
A churn model is a mathematical representation of how churn impacts your business. Churn calculations are built on existing data – the number of customers who left your service during a given time period. A predictive churn model extrapolates on this data to show future potential churn rates. This helps you predict your revenue and avoid risks like overspending.
Types of churn: voluntary vs. involuntary
Churn traditionally falls into two buckets: voluntary or involuntary. Analyzing how these types of churn impact your business provides a comprehensive picture of how and why customers cancel their accounts. With that knowledge, it’s easy to formulate a plan for proactively addressing the issue.
Voluntary churn
Voluntary churn is characterized by customers actively choosing to cancel their service. This can happen for any number of reasons, including:
- Switching to a competitor
- Closing down a business venture
- Negative customer experiences
This type of churn is preventable. A customer who’s thinking about leaving you for a competitor might be convinced to stay if they’re reminded of the value your service provides. However, it is tricky to dissuade customers from voluntary churn since the reasons are often complicated to solve.
Involuntary churn
Involuntary churn occurs when a customer’s account is canceled when they didn’t intend it to be. Some examples of involuntary churn include:
- Expired credit cards
- Reaching the limit of available funds
- Failed mechanical payment processing
- Fraud protection on recurring payments
Research by ProftiWell (now part of Paddle) found that 20-40% of total churn comes from involuntary churn.
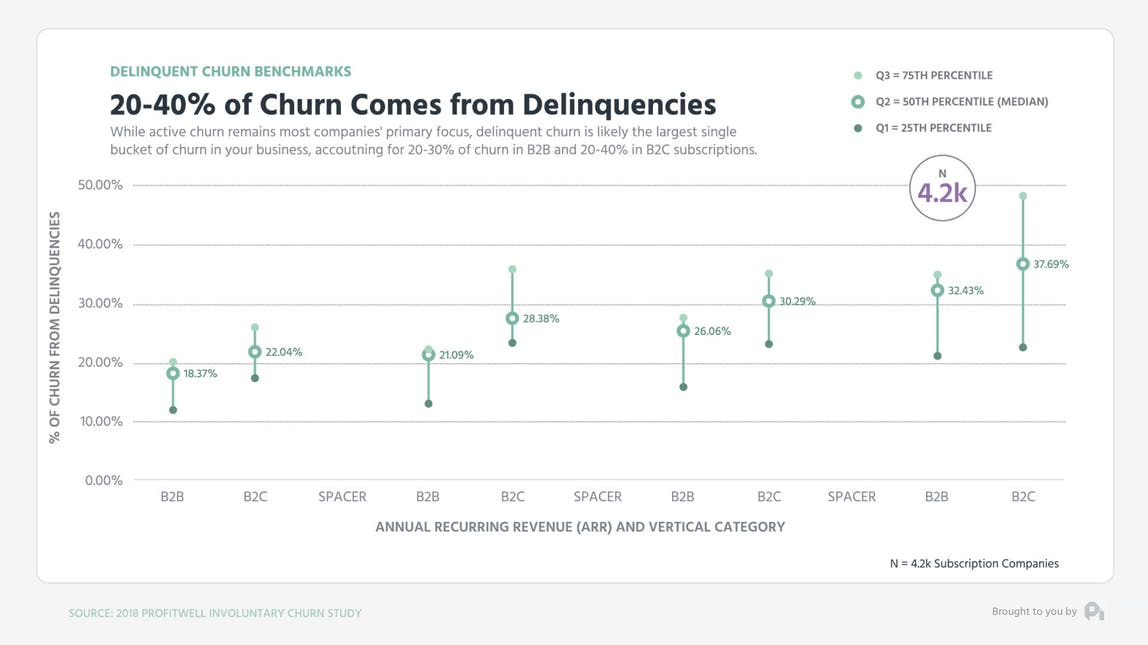
Involuntary churn is more easily prevented than voluntary churn because it is almost always the fault of a mechanical failure in your internal processes. In most instances, a proper system of dunning emails and notifications can take care of delinquencies at the company level.
Understanding how voluntary and involuntary churn differ helps you segment your customer base and create a more comprehensive model of churn. Use this data to analyze the impact that each type of churn has on your overall churn rate.
The data you need to build a churn model
Building a predictive churn model for your business starts with categorizing everything you know about your customers. Most businesses are already tracking this data, so you just have to know how to use it. Every customer data point you have helps build a more targeted churn model.
Customer information
The first step is building comprehensive customer profiles. At their core, these profiles should include the customer’s name and address but can be expanded to include job title, employment status, team size, and much more.
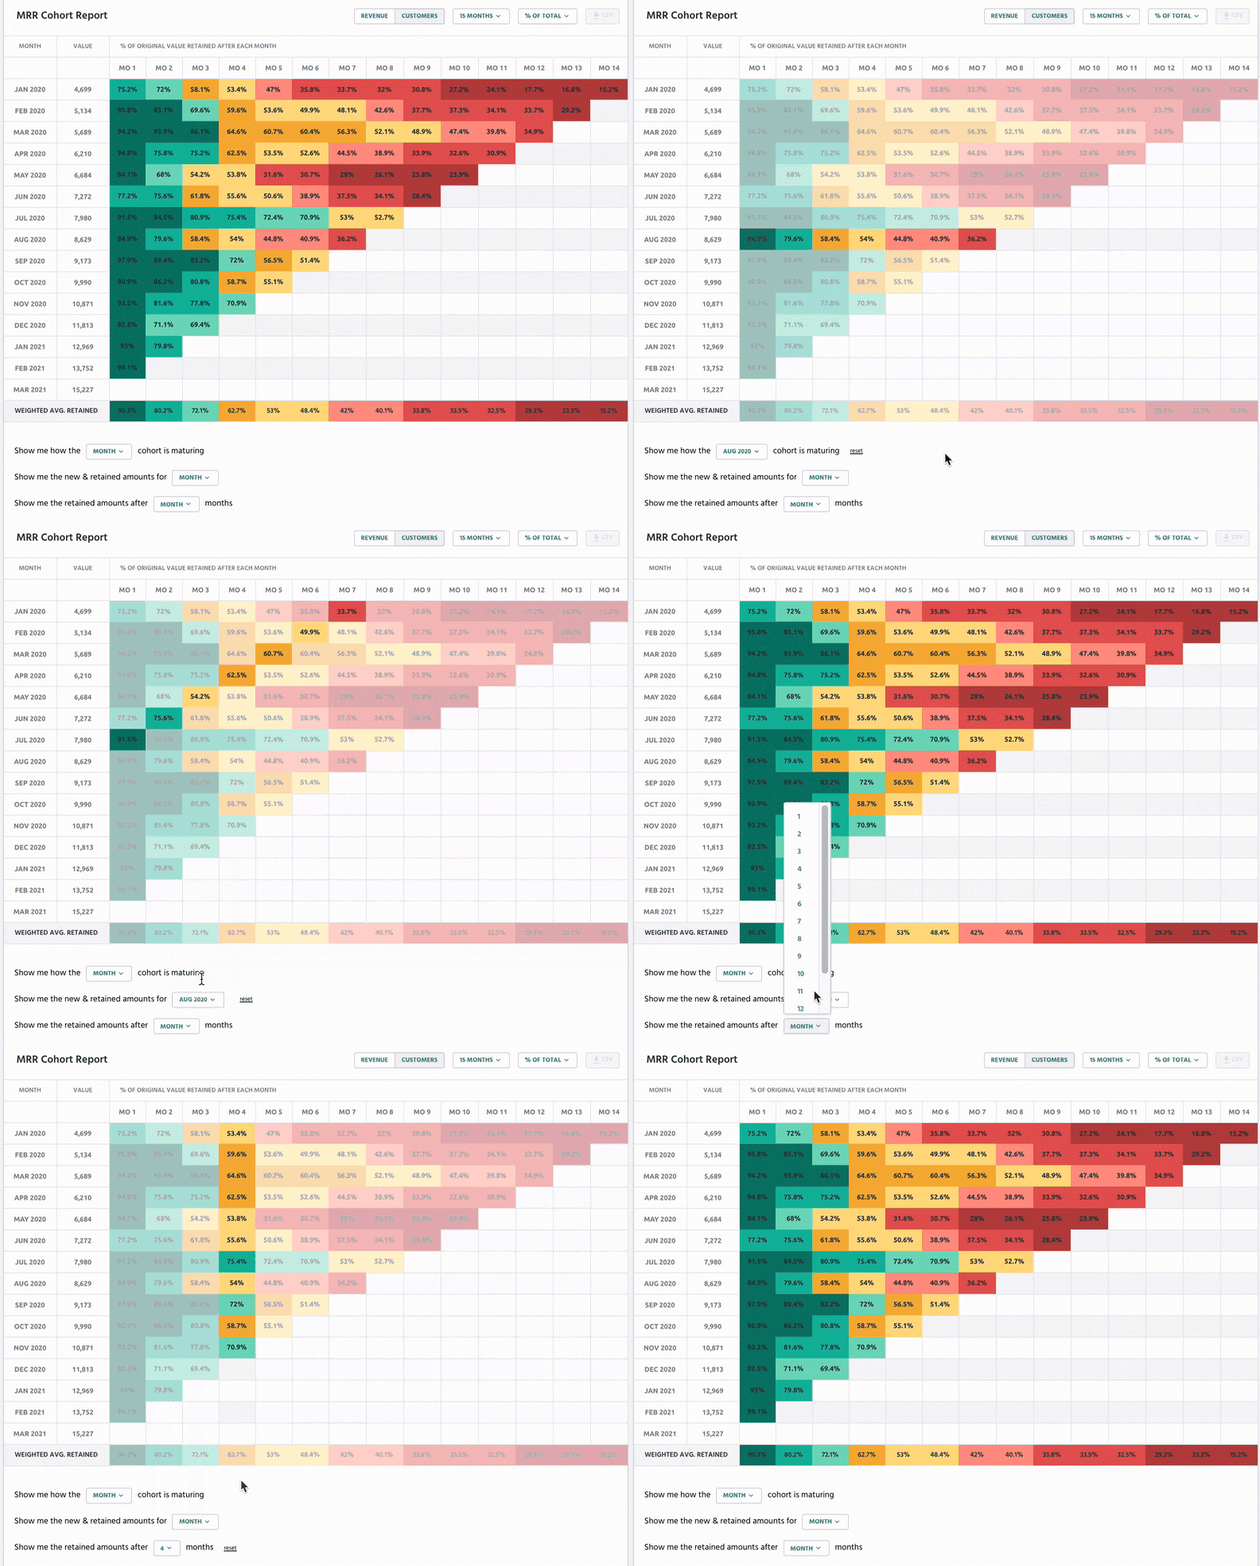
With this data, you can easily spot patterns in churned customers related to their demographics and segment them into cohorts for more granular analysis. Different customer types will churn in significantly different ways.
With Retain, businesses can track customer cohorts over time:
Purchase Information
Expand on your customer profiles by including information about their purchase and billing history. Knowing when a customer signed up, when they canceled your service, their payment history, and overall lifetime value (LTV) helps you build a clear picture of how billing processes impact your churn.
As a SaaS company, it’s important to include a customer’s chosen pricing tier in your churn data as well. This information helps you see how your pricing decisions affect the way customers churn from your service.
Interaction Information
One of the biggest contributors to voluntary churn is the customer experience. Make sure you’re tracking every interaction a customer has with your team as well as your product. Including this information in your customer profiles helps you see the impact of your product and the customer experience on churn rates.
Tracking past interactions can also be valuable for surfacing points along the customer journey where churn is more likely to occur.
Customer profiles are the basis for more in-depth churn analysis. With this data, you can start looking for patterns in how and why different types of customers leave your service.
Look for patterns in how customers churn
Comprehensive customer profiles help you see what types of customers are canceling their accounts. Now it’s time to figure out how and why they’re churning. Ask yourself the following questions to learn more about the pain points in your product and customer experience that lead to a customer deciding to churn.
Is this involuntary or voluntary churn?
Did a customer actively choose to cancel their account, or did they churn because of a failed credit card payment? It’s important to segment your churned customers into these two buckets first. Your model for voluntary churn will rely on more customer-focused data points than your model for involuntary churn, which will deal mostly with the internal mechanisms of your business.
At what point do customers drop off?
Building an effective churn model requires a solid grasp of why customers churn at certain times as opposed to others. The underlying reasons for a 30-day-old customer leaving are much different than the reasons for a 90-day or 6-month-old customer.
Let’s say you see that 35% of customers churn before the 30-day mark. That might indicate there are issues in your on-boarding process that don’t help customers get acclimated to the service fast enough.
What common complaints do churned customers have?
When someone cancels, you should always send an exit survey to find out why. Each response is a potential indicator of how your service failed the customer. We recommend making these surveys anonymous to encourage honest and direct feedback.
Does seasonality affect customer churn?
Seasonality can impact even the most established SaaS business. If a large cohort of your customers cancels in January, for example, that’s something to investigate. Consider the fact that budgets are usually reviewed on a quarterly basis, so churned customers in the new year might be a result of financial changes.
These questions provide insight into the many reasons a customer might cancel their service. The answers act as data points you can use when building your churn model.
How to build a churn model manually
With your customer profiles created and analyzed, it’s time to talk through how to create an actual churn model. As this is a mathematical process, you’ll need a strong understanding of statistical concepts and data science to move forward. You’ll also need a significant amount of data to perform these calculations.
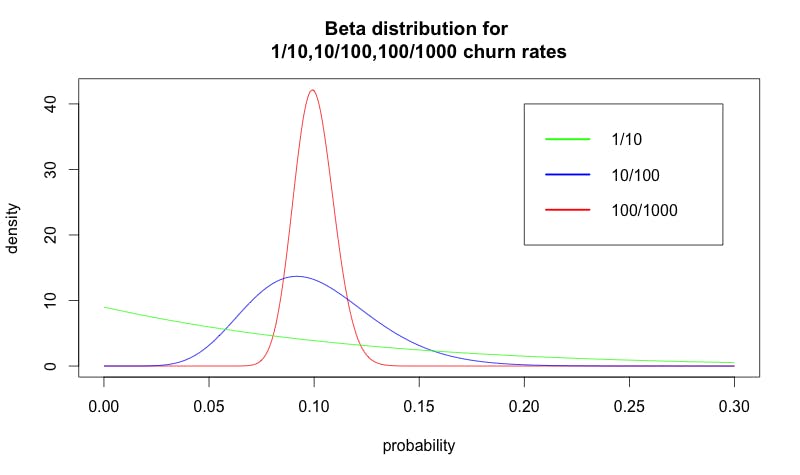
Example beta distribution of churn via Neil Patel.
If you only rely on a small sample size, like the green line in the above graph, you’ll never be able to create an accurate picture of your overall churn. The more data you have at your disposal, the more specific your churn model will be.
Let’s get started.
1. Gather and review your data
You’ve spent all this time building up a data set—every bit of customer information you have is a valuable data point in the upcoming churn calculations. Make sure you review all of your data for accuracy and validity before moving on to the math.
2. Set up a regression formula
Mathematical modeling for churn is built on a statistical process called logistic regression. This process determines the relationships between points in your data set based on a formula and limits the outcome to between 0 and 1. You’ll take all the customer information, purchase history, SaaS metrics, and prior churn data and turn it into a statistical prediction of when certain types of customers might churn in the future.
Your formula and potential outcome will look like this:
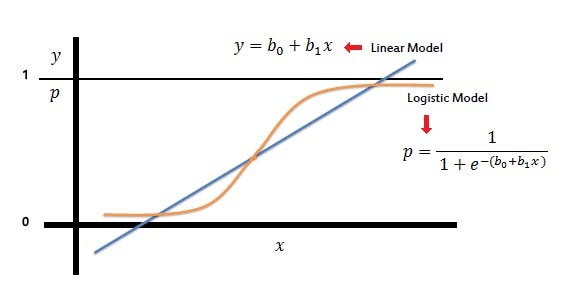
Logistic model vs. Linear model via Saed Sayad.
You’ll likely need to employ a data scientist to determine the correct variables and constants required to build a formula. Learn more about this process in The Complete Guide to Statistics for the SaaS Executive.
3. Come up with a retention plan
Once you’ve modeled churn through the logistic regression formula, you’ll be able to more clearly analyze retention and see the probability of certain customer segments churning.
To help maximize retention, use this information to formulate a plan, based on these findings, that targets each of your cohorts directly. The probability of certain customers churning your service earlier than others will make it easy to prioritize your actions.
4. Implement and track your results
With a plan in place, it’s time to implement your retention strategy. As you do so, keep track of how it impacts your churn rate over the next few months. Gather enough data to see the real impact of your efforts before making additional changes to your plan. This data might look something like this:
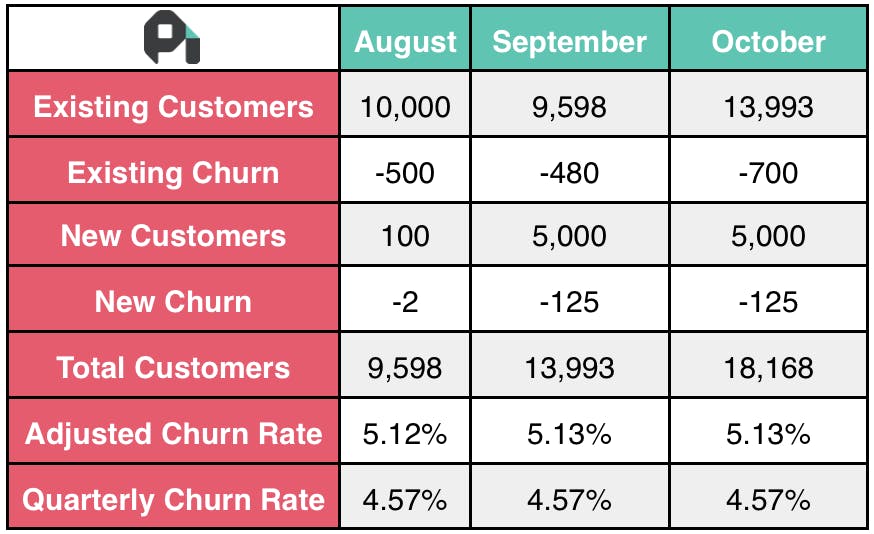
Example churn data from The Best SaaS Churn Formula.
5. Test retention strategies
Your churn model will provide probabilities for a number of different cohorts in your customer base. Make sure you’re always testing out new strategies and recording the impact on these customer segments. Each subsequent test can help you create a better model for the future.
There’s a lot more that goes into creating a mathematical model of your churn than you think. Analyzing this information takes time and resources from across your team.
Easy and accurate churn models with ProfitWell Retain
Creating a predictive churn model for your business is a lot of work and requires considerable expertise and mathematical knowledge. Fortunately, there is an easier way to build a churn model—ProfitWell Retain.
1. Get ProfitWell Retain for your business
ProfitWell Retain, a Paddle product, has one of the largest databases of subscription data on the planet. Using this information, we’ve built a tool to help model churn for you. Our retention experts have years of experience working with hundreds of SaaS companies to help you make sense of your data and make smart decisions for the future of your business.
2. Minimize churn and keep more customers
ProfitWell Retain is easy to set up, secure, and offers industry-leading retention rates for customers. Using our tool, we’ll demystify the modeling and retention process and give you back time that you can spend on keeping customers happy and growing your business.
Modeling churn helps you understand it
A predictive churn model is one of the best tools you have for deciding where to focus your retention efforts. It helps you weed out both types of churn and focus on where your team can make the most impact. That focus lets you spend your time looking at new ways to keep more customers and grow your company. The less customers you lose to churn, the more revenue you’ll be able to capture from them.


