 Paddle Billing
 ProfitWell Metrics

Join our newsletter for the latest in SaaS
Now that we’ve passed the halfway point of 2024, it’s a good time to sit back and take stock, before facing the rest of the year.
In that spirit, June’s SaaS Market Report will be a special edition - dedicated to looking back at the SaaS market in H1, predicting SaaS performance for the rest of the year, and sharing strategies for the SaaS market’s “new normal”.
We’re getting ahead of ourselves though - before we review 2024, let’s switch back to our regularly scheduled programming - and dive into this month’s SaaS performance👇
This is the latest in our ongoing SaaS Market Reports, which track the movement of the ProfitWell Subscription Index, and its underlying growth and retention trends. This month, we examine 2024 performance.
Subscribe to the SaaS Market Report newsletter to get these updates in your inbox.
KP and Gavin discuss this month's data. Scroll down to read the full report.
B2B remains steady, despite summer volatility
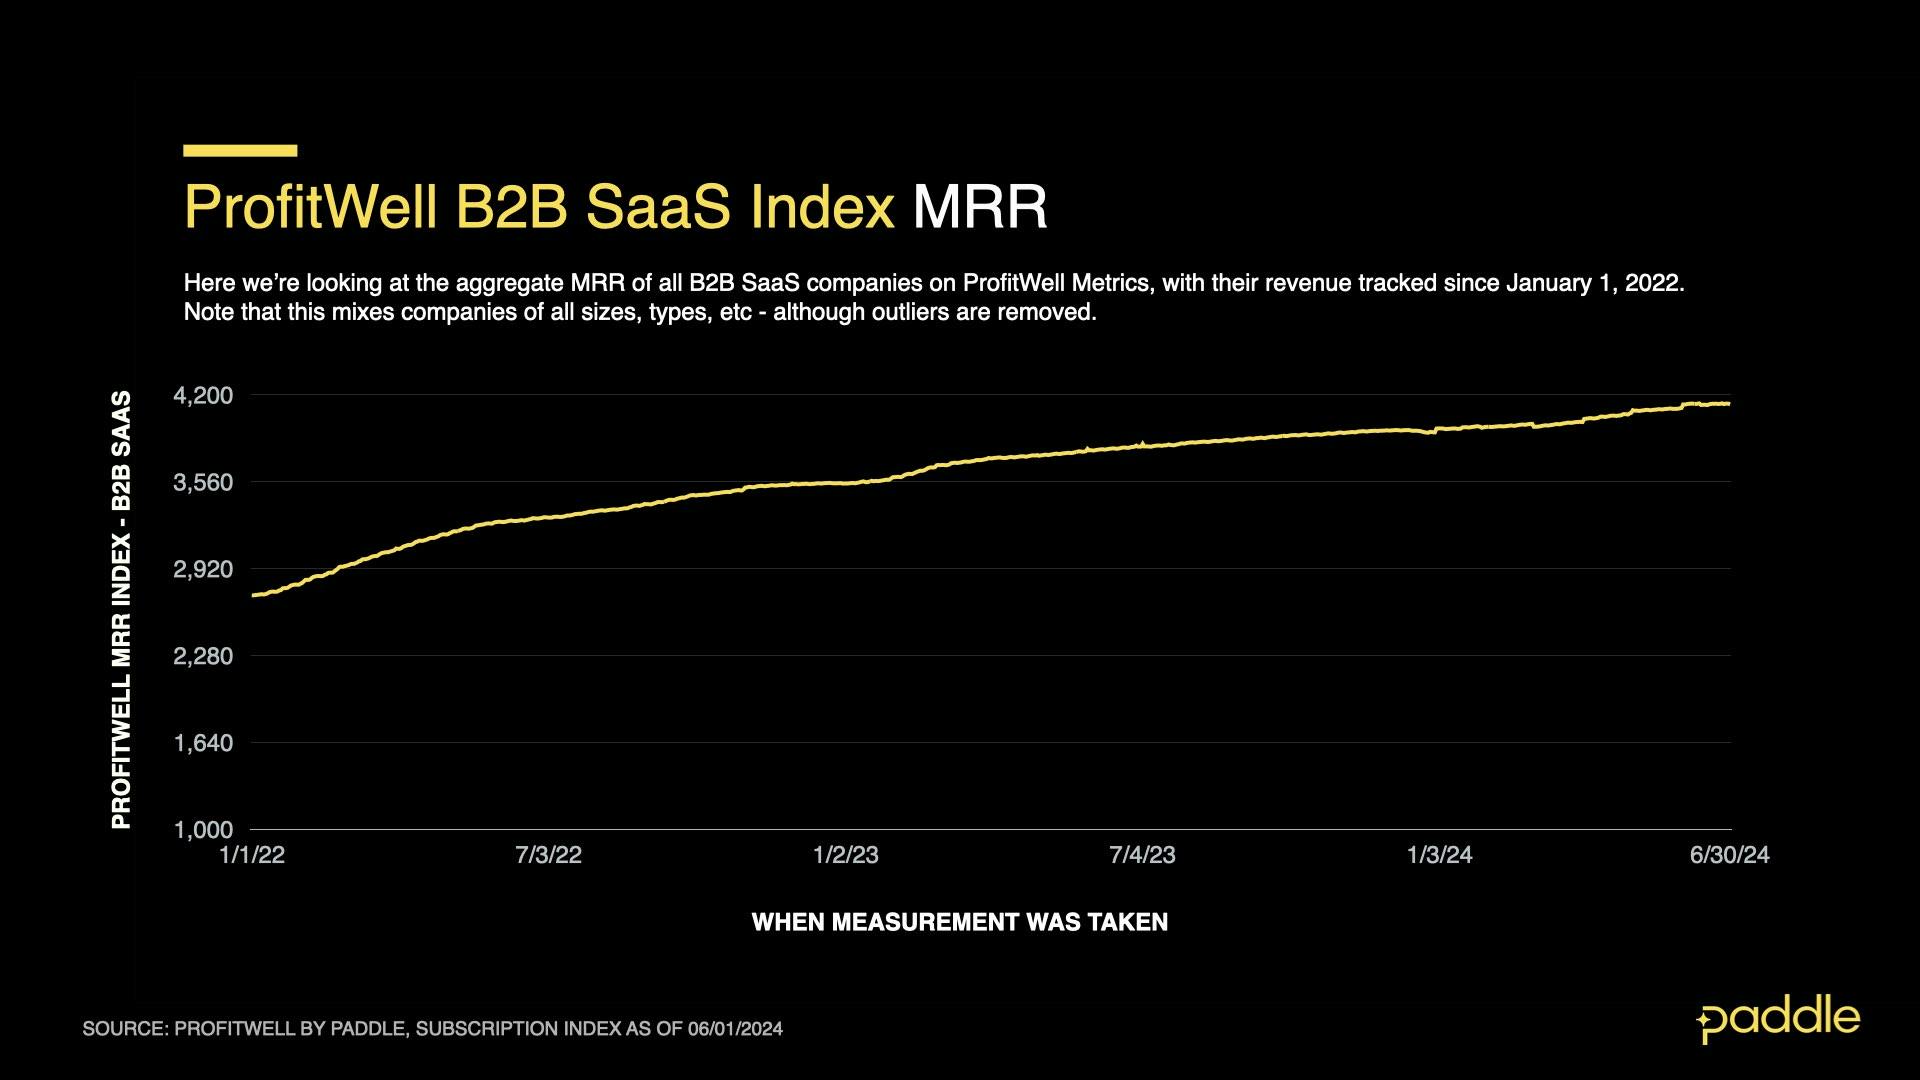
The ProfitWell B2B SaaS Index tracks the cumulative monthly recurring revenue (MRR) from a sample of the 34,000+ companies on ProfitWell Metrics. By measuring the revenue performance of this cross-section of companies over time, we can objectively observe how quickly the sector is growing (or not). The index does not adjust for inflation. Explore the free demo of ProfitWell Metrics here.
In June, B2B saw continued, stable growth, with the Profitwell B2B SaaS Index reaching a peak of 4136, and compound annual growth (CAGR) averaging 8.7%.
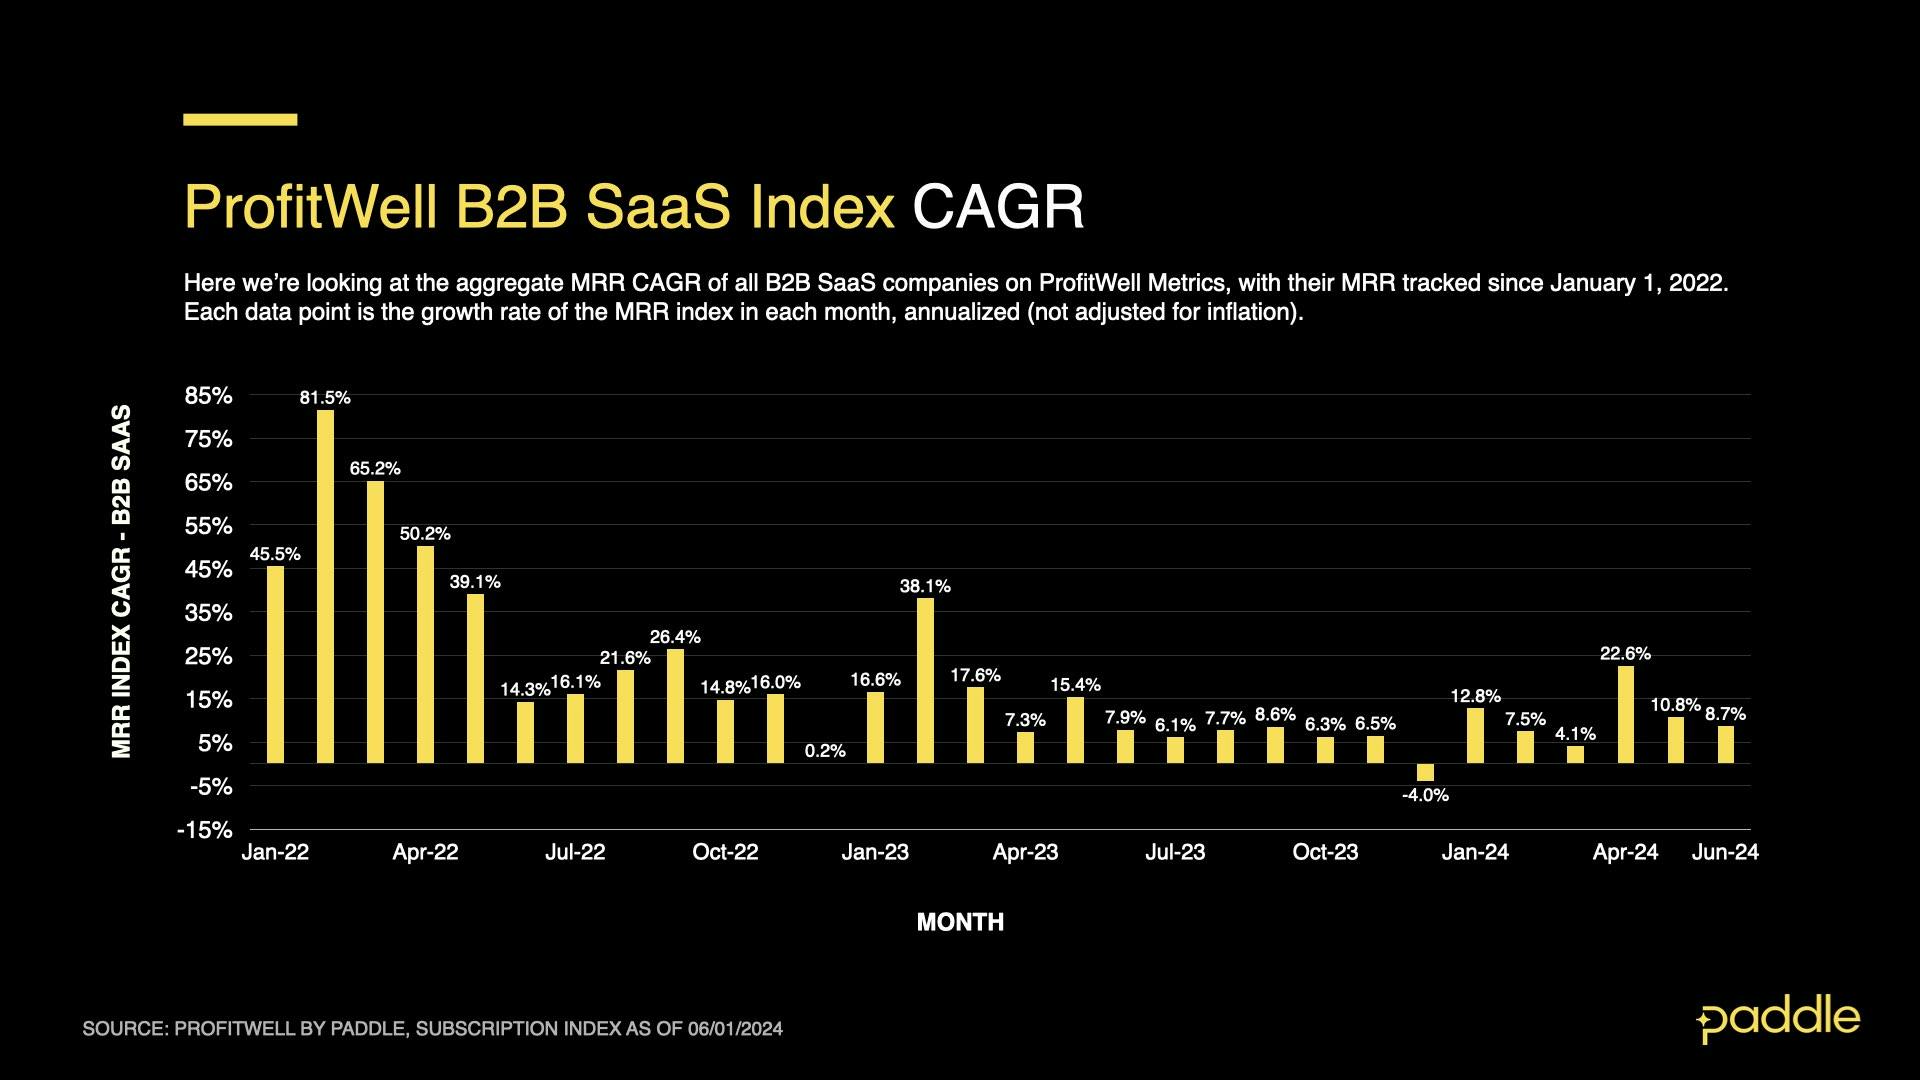
This was down from 10.8% in May, but largely in line with May’s predictions that CAGR would hover near ~11% for the rest of 2024, as B2B revenue’s driving forces (new sales, churn, upgrades & downgrades) remain in a stable equilibrium, subject to temporary fluctuations.
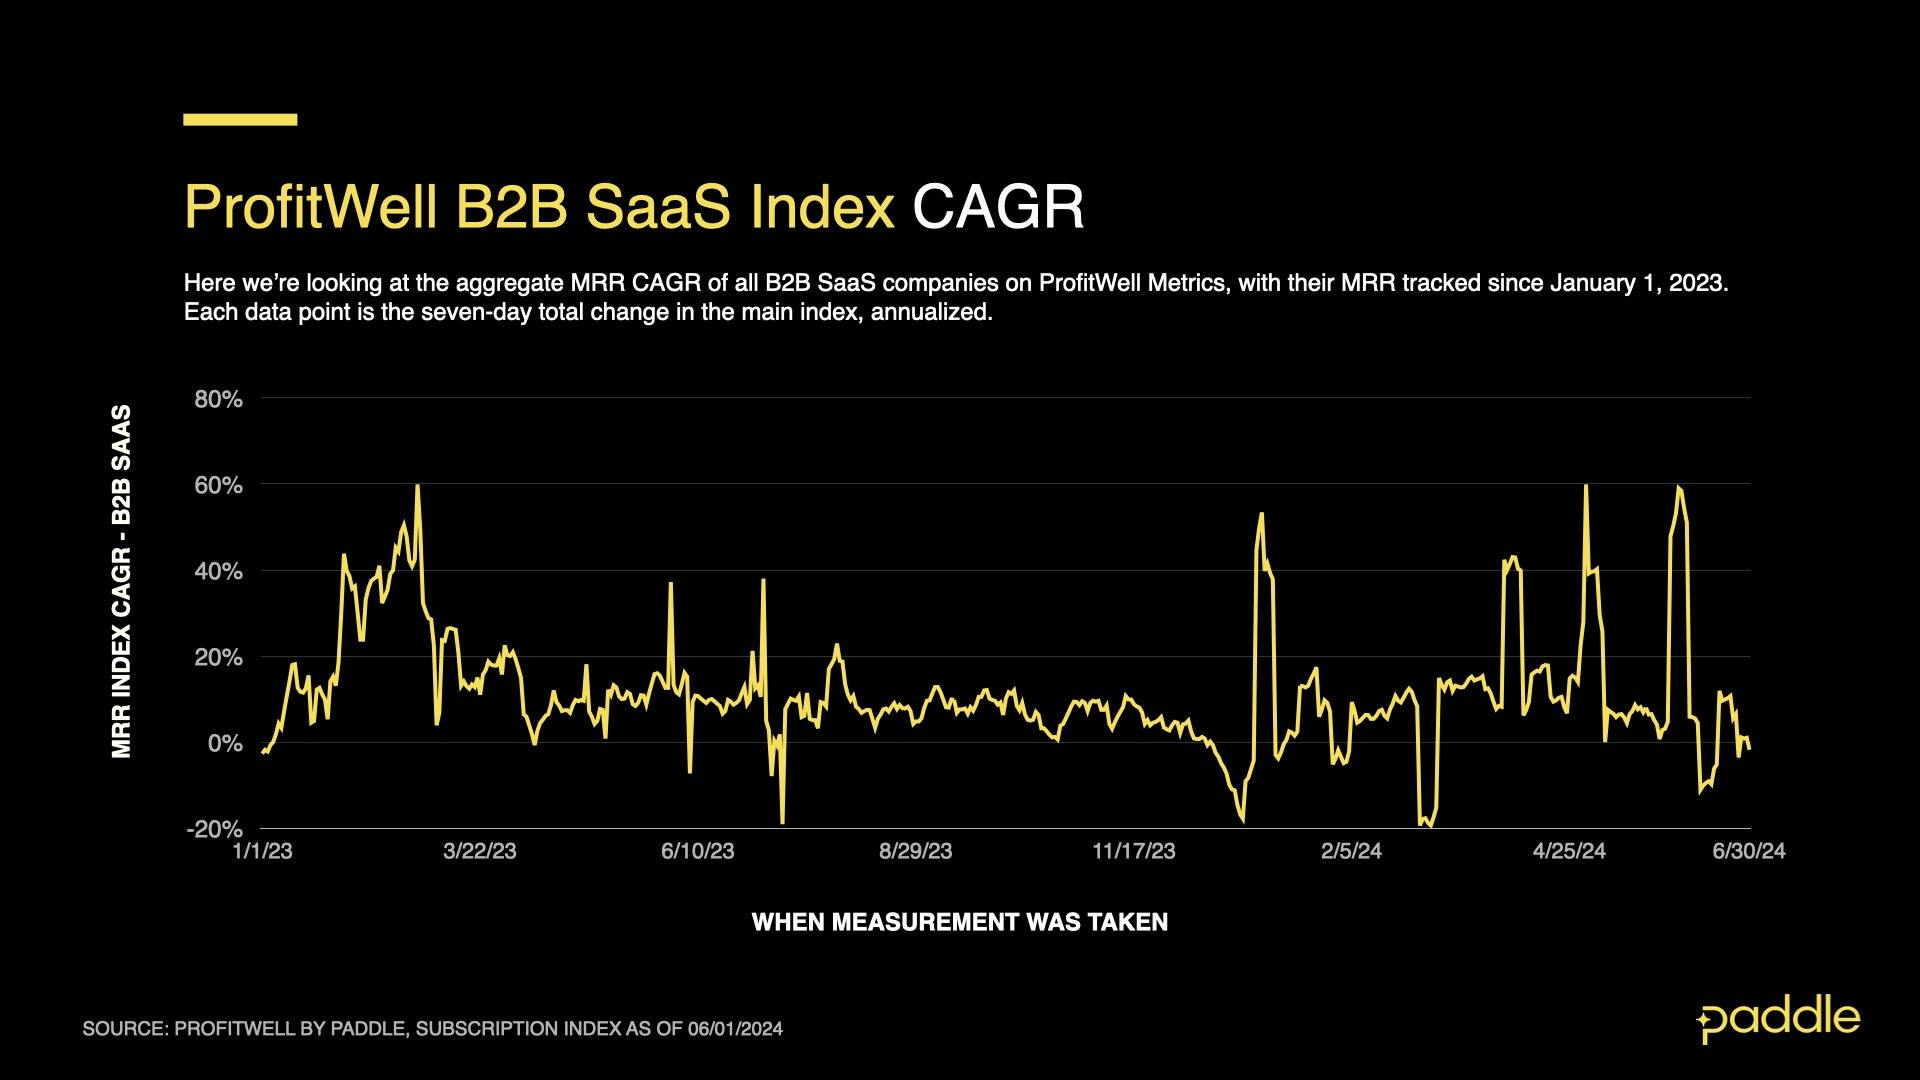
That said, when we zoom in to B2B CAGR at the day-level, we find that June had unusually high volatility, with a 1-week spike to 60% CAGR at the beginning of the month, followed by a reversal to -10%, before stabilizing at 10% CAGR.
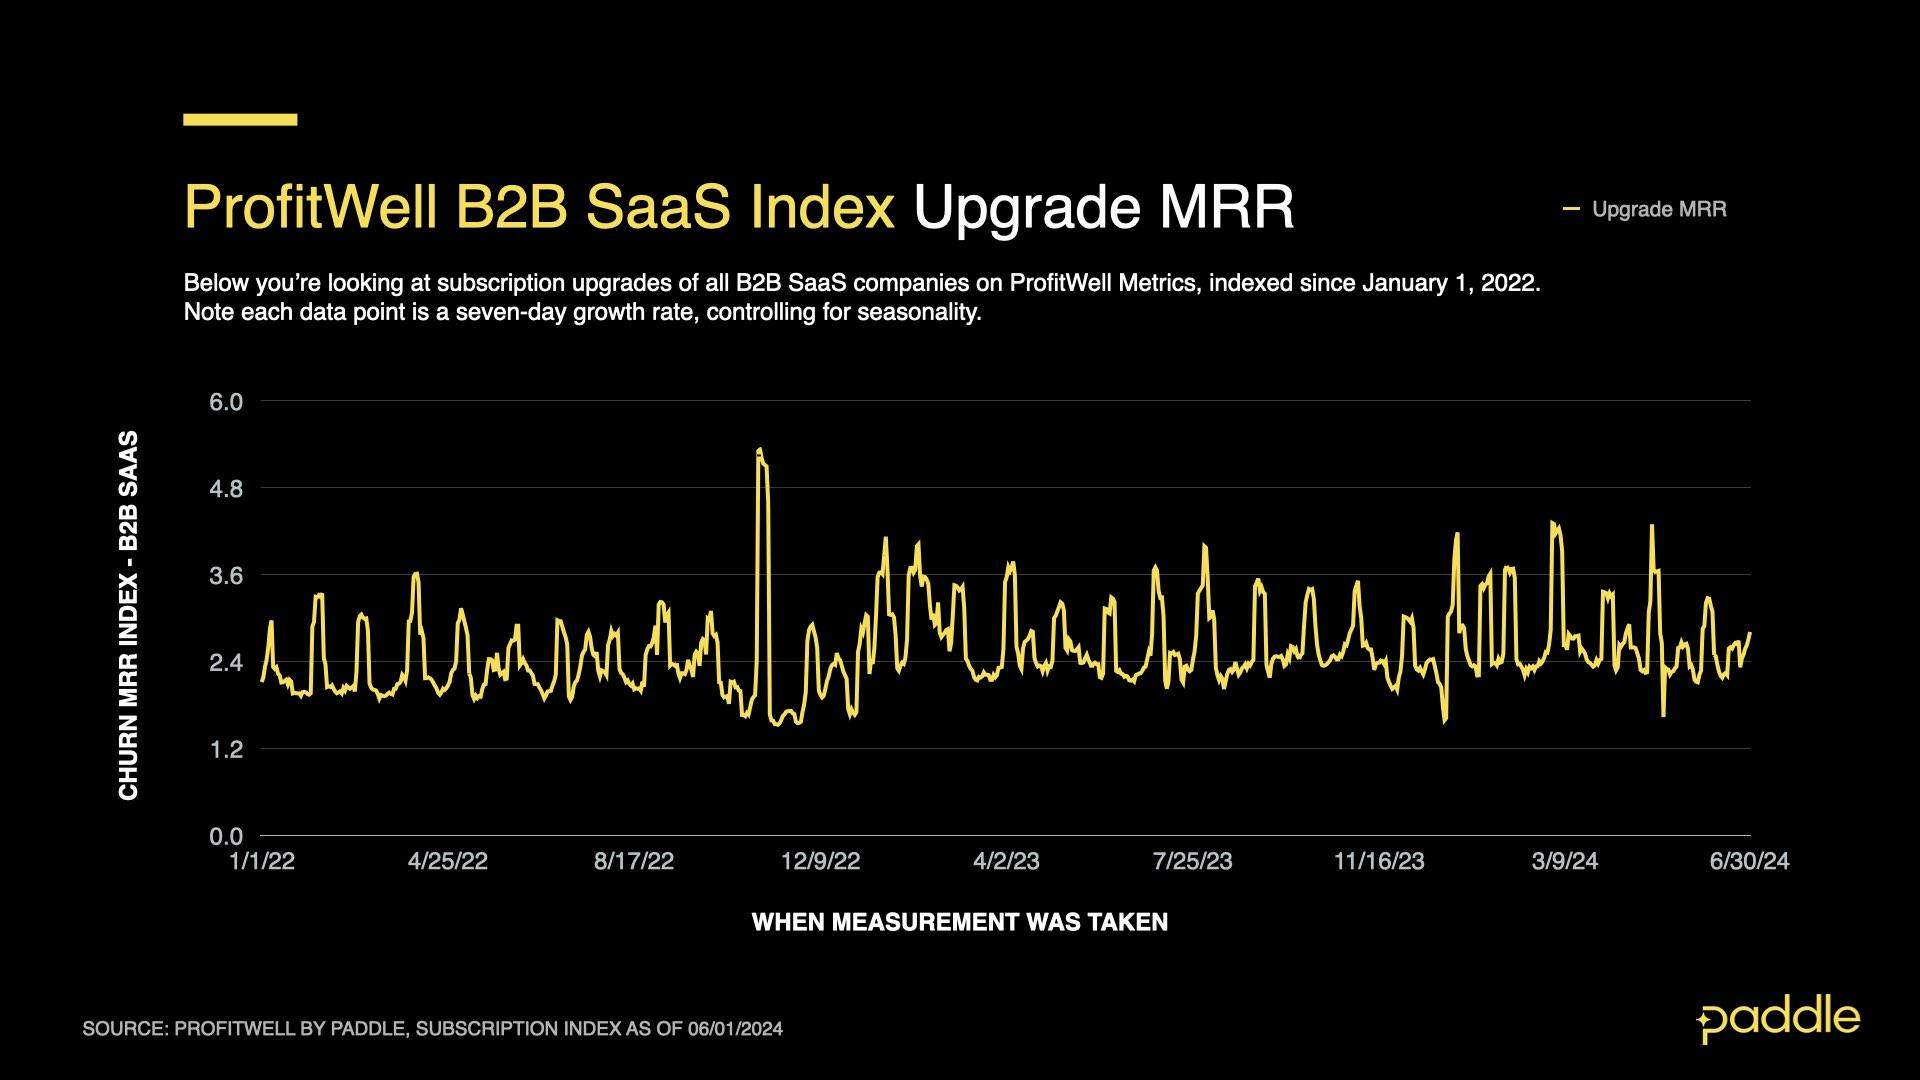
Examining the Upgrade Index begins to reveal why. Upgrades had a week-long, 44% spike to 3.27 on the index, creating volatility in daily CAGR, while pushing its June average upwards.
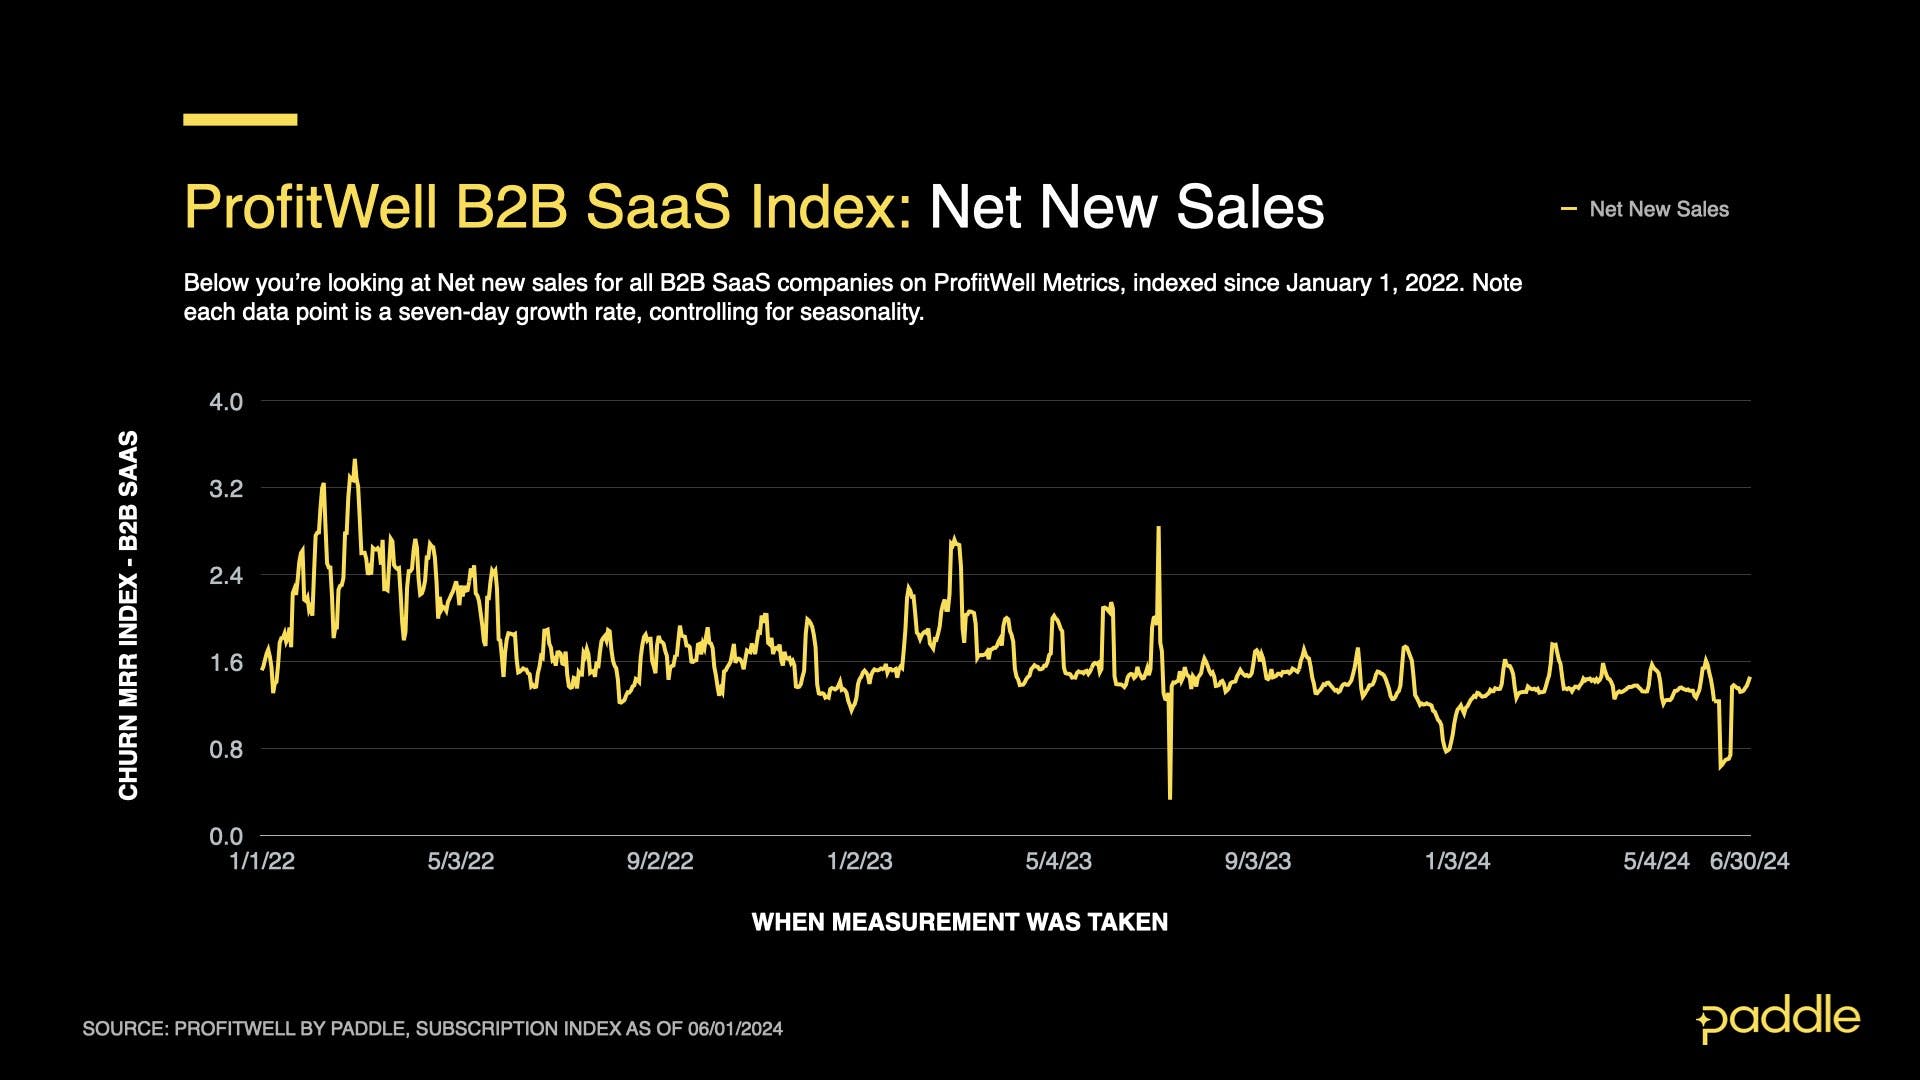
In contrast, when observing the New Sales Index, we find a sharp drop of 48% to a value of 0.64, also lasting a week - adding volatility and pushing June CAGR downwards.
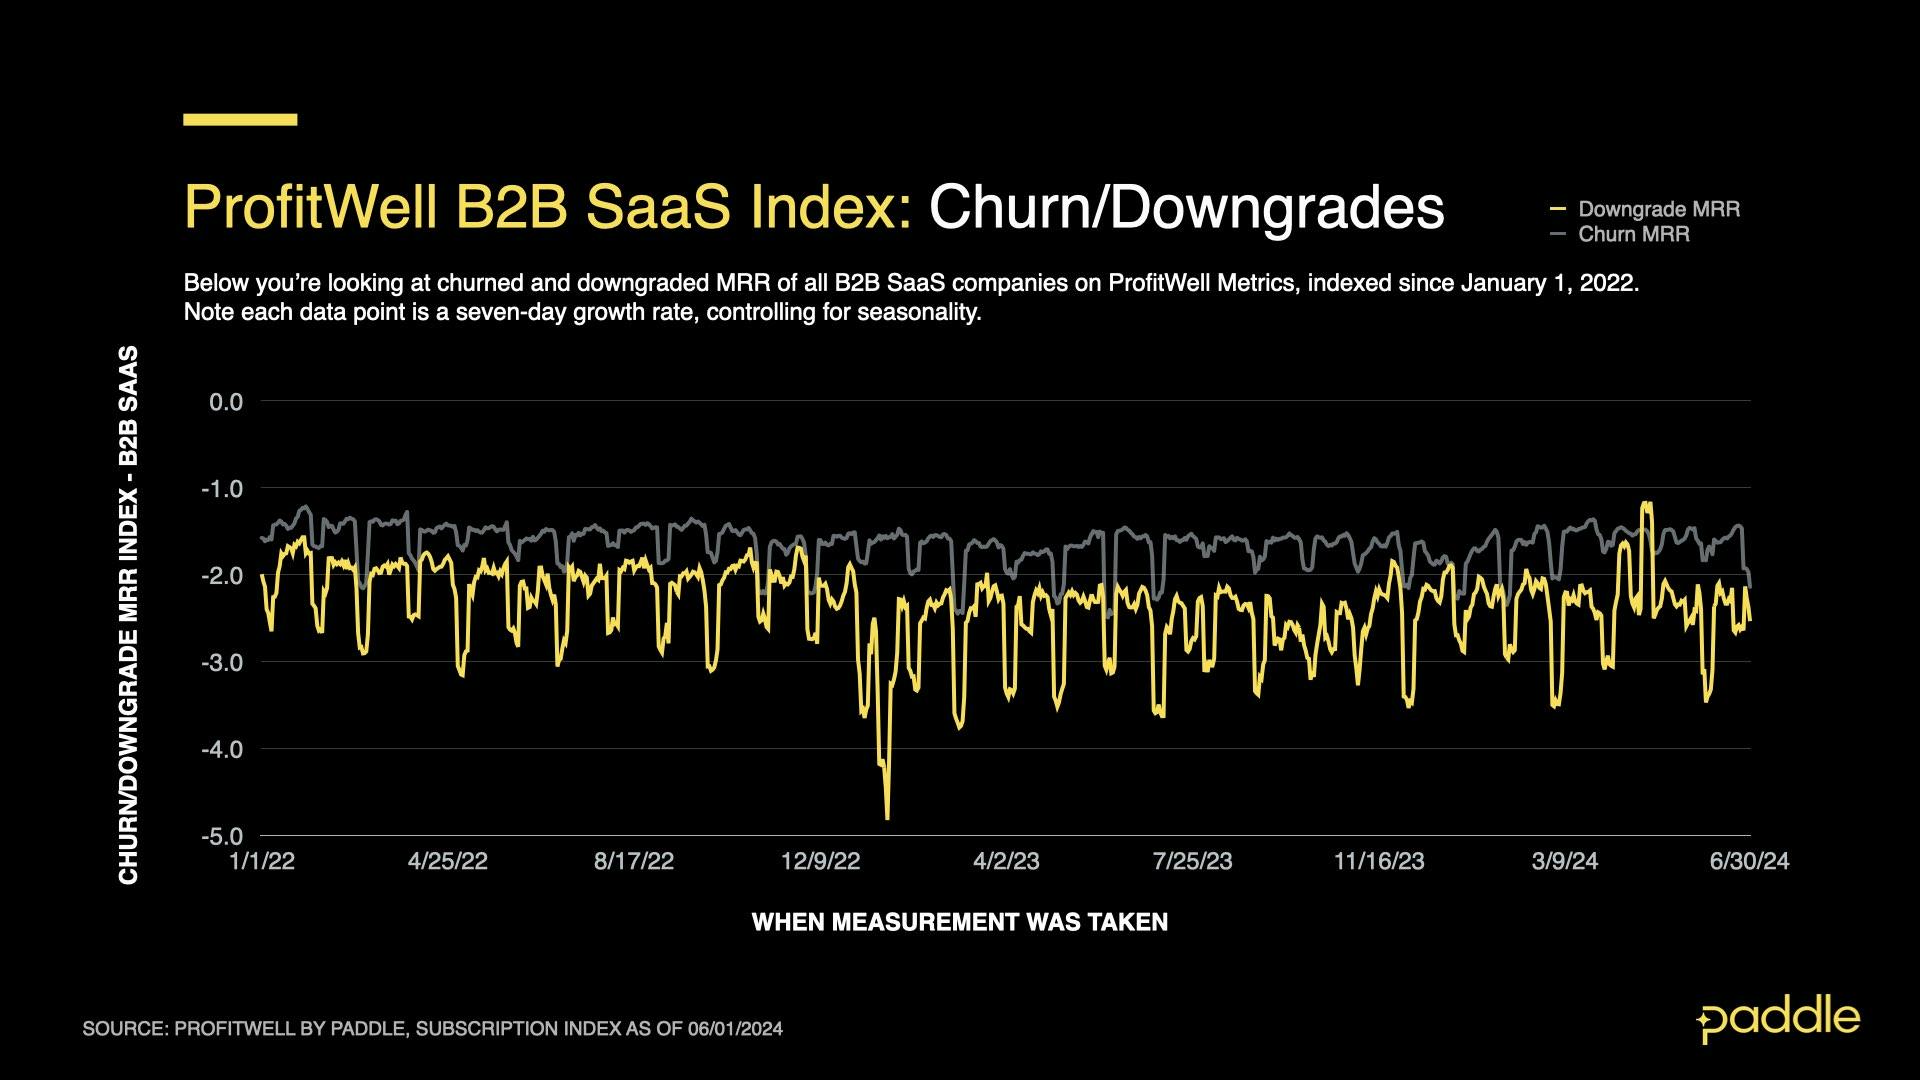
Meanwhile, downgrades told a similar story to new sales, spiking by 45% for one week, to an index value of -3.47. Churn remained comparatively stable, with an average of -1.67, a mere 5.1% increase over May’s value.
New sales, upgrades & downgrades battle it out
Combining the data from these growth drivers reveals why average CAGR remained stable from May (10.8%) to June (8.7%), while day-to-day CAGR experienced wild fluctuations.
New sales, upgrades and downgrades experienced spikes of nearly 50%, creating daily fluctuations in CAGR; but the spike in upgrades counteracted the spike in downgrades & drop in new sales, causing average CAGR to remain fairly stable.
While there’s no conclusive data on the source of these spikes, we believe they are driven by slowed purchasing decisions in the summer (as employees take time off); and finance teams reviewing software purchases (and upgrading or downgrading), at the end of Q2.
B2C slows for summer (vacation)
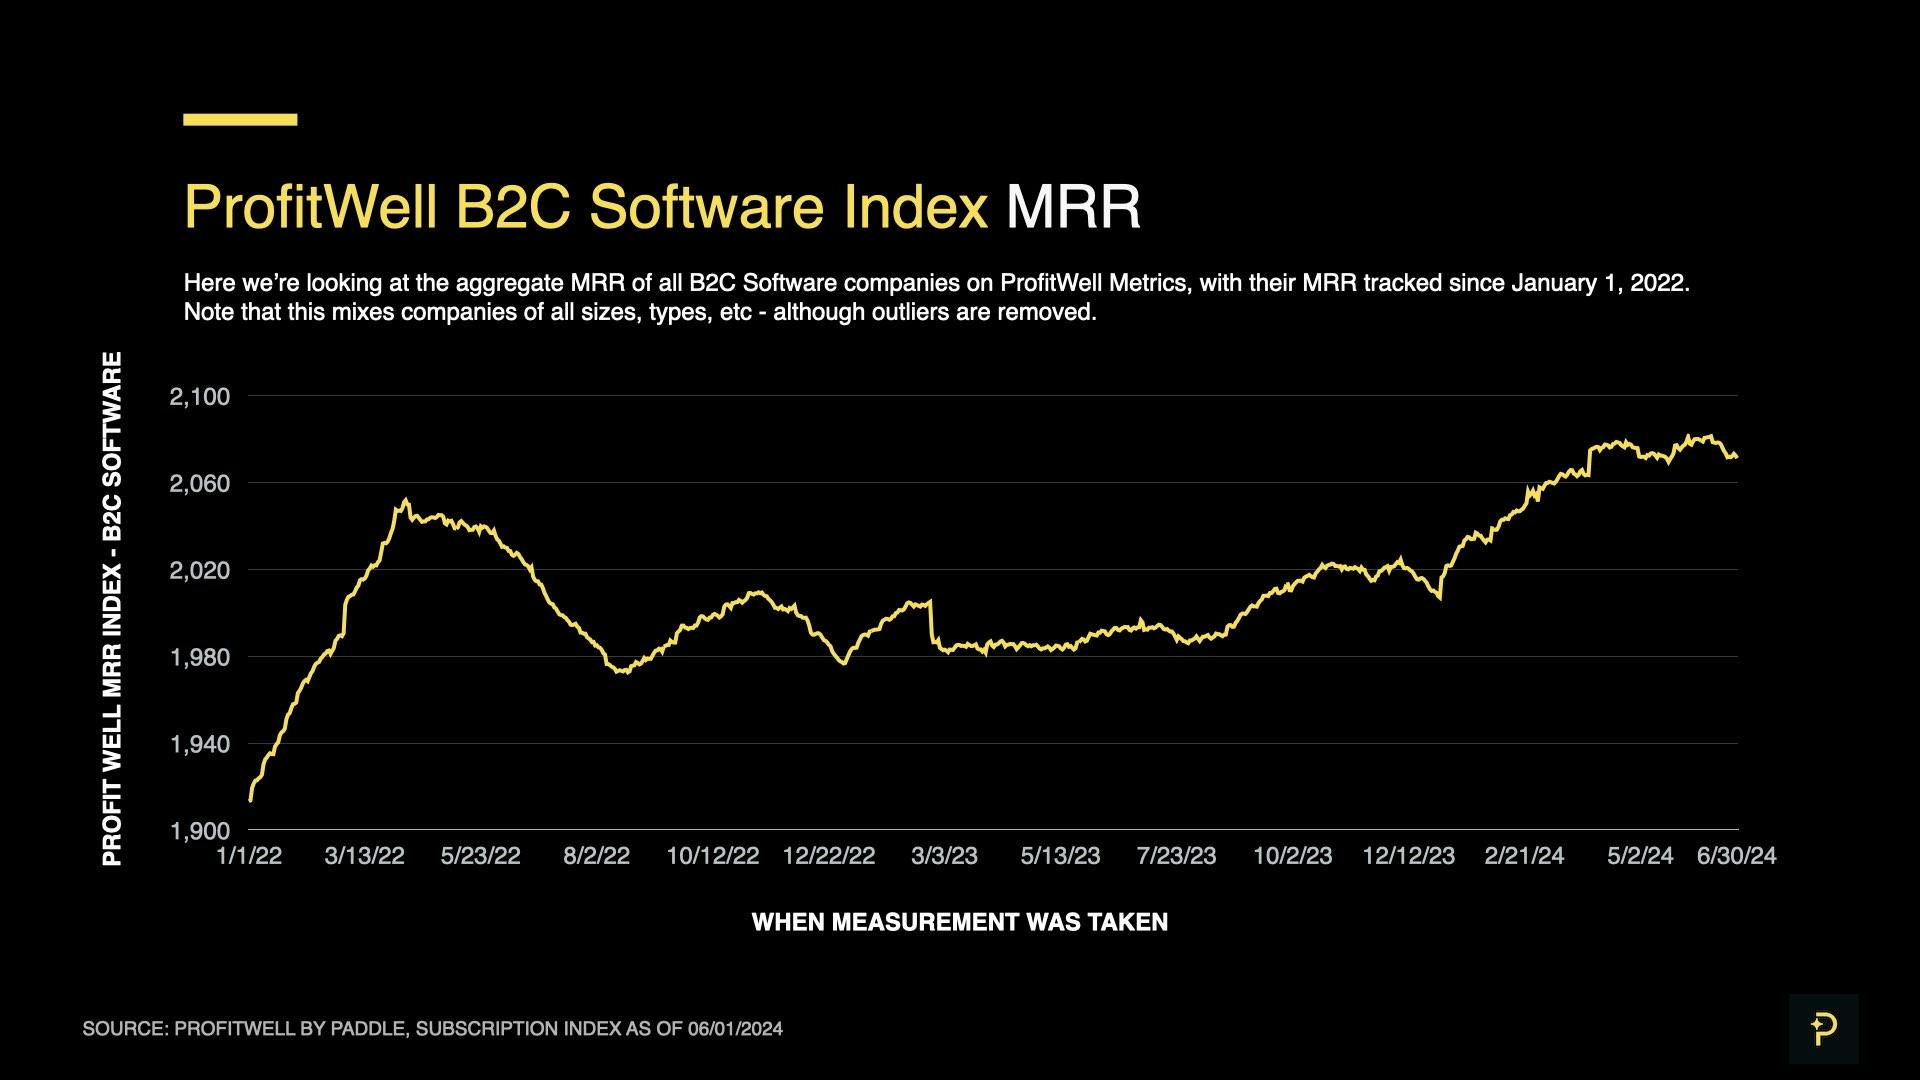
Moving onto B2C growth, the Profitwell B2C Index ended June with a value of 2071, down from its previous peak of 2080, at the end of May.
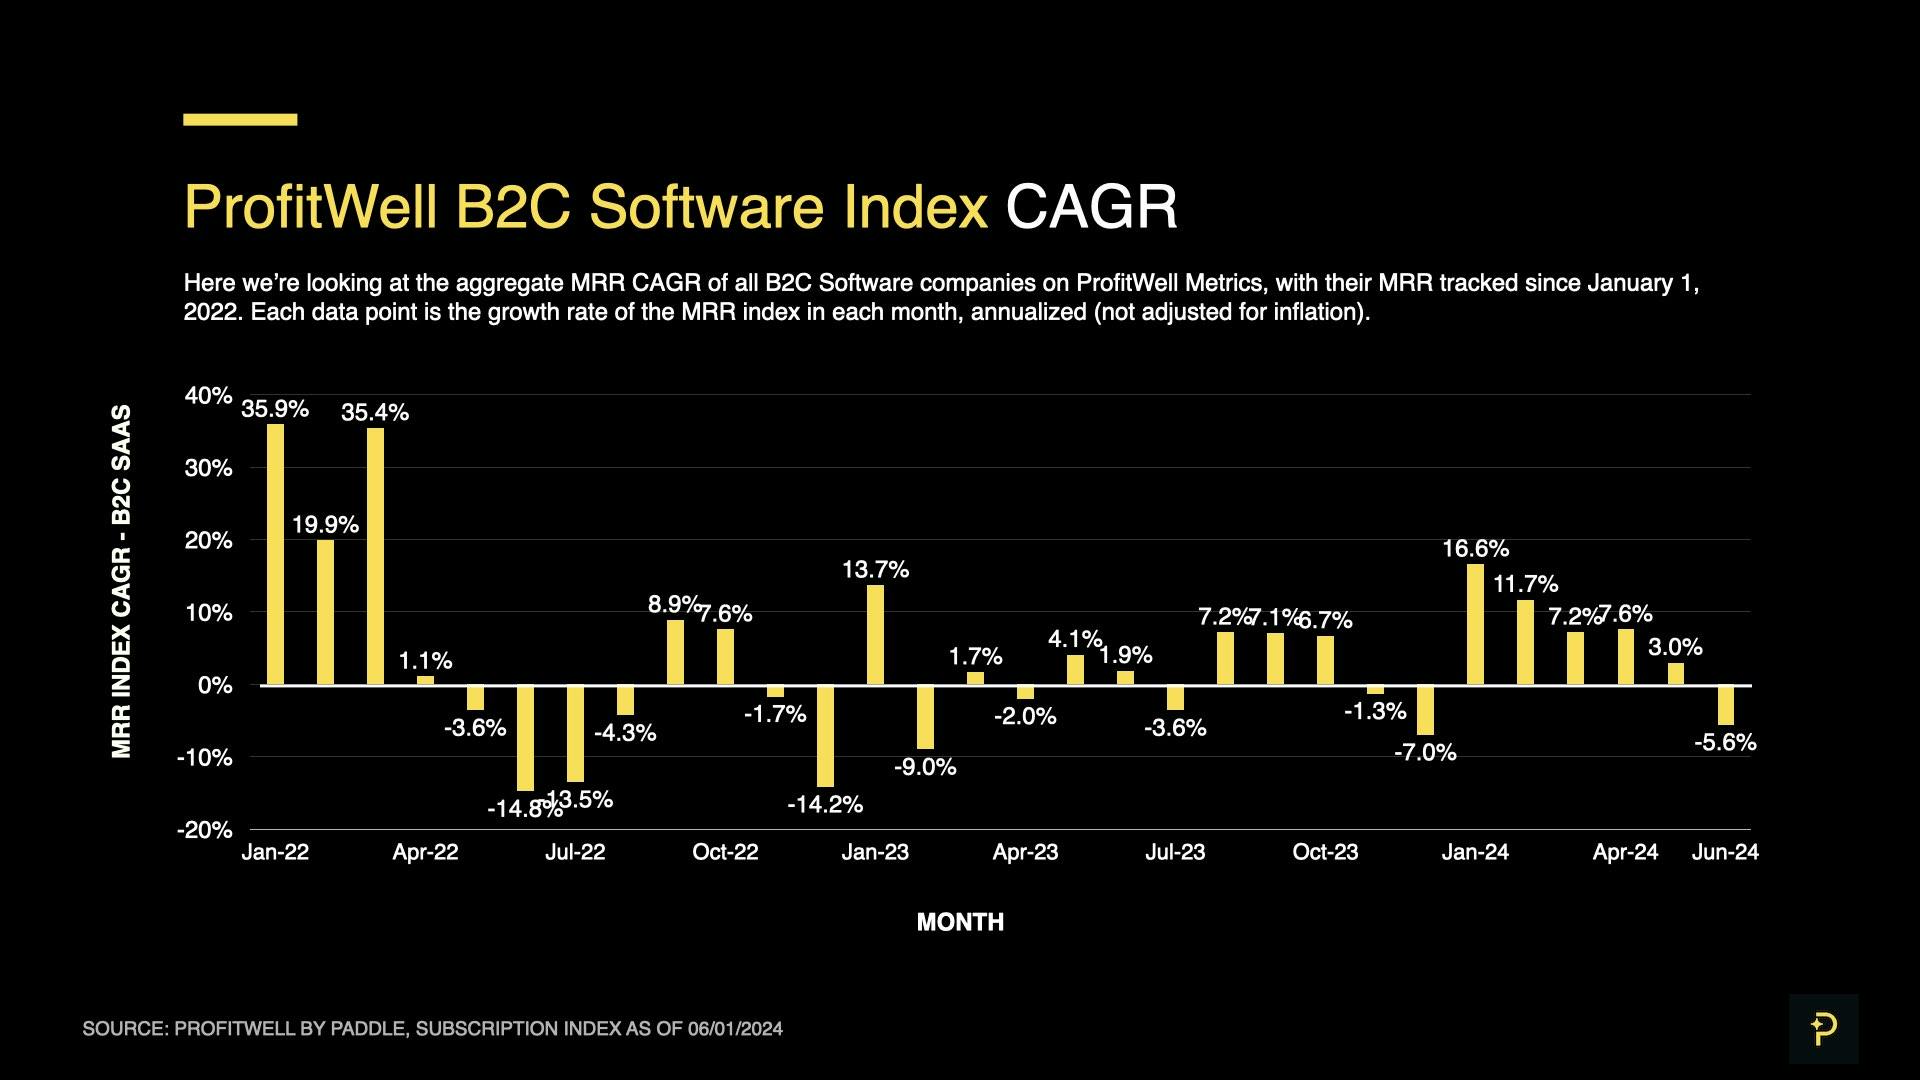
The dip was also reflected in our monthly CAGR data, where June hit a negative CAGR for the first time in 6 months. If you’re a B2C SaaS operator, there’s no need to panic though, as a summer slowdown is a common (and temporary) pattern in consumer software spend.
Digging a bit deeper into the drivers of revenue growth, we find this slowdown was caused by a perfect storm of decreased sales, and increased churn & downgrades.
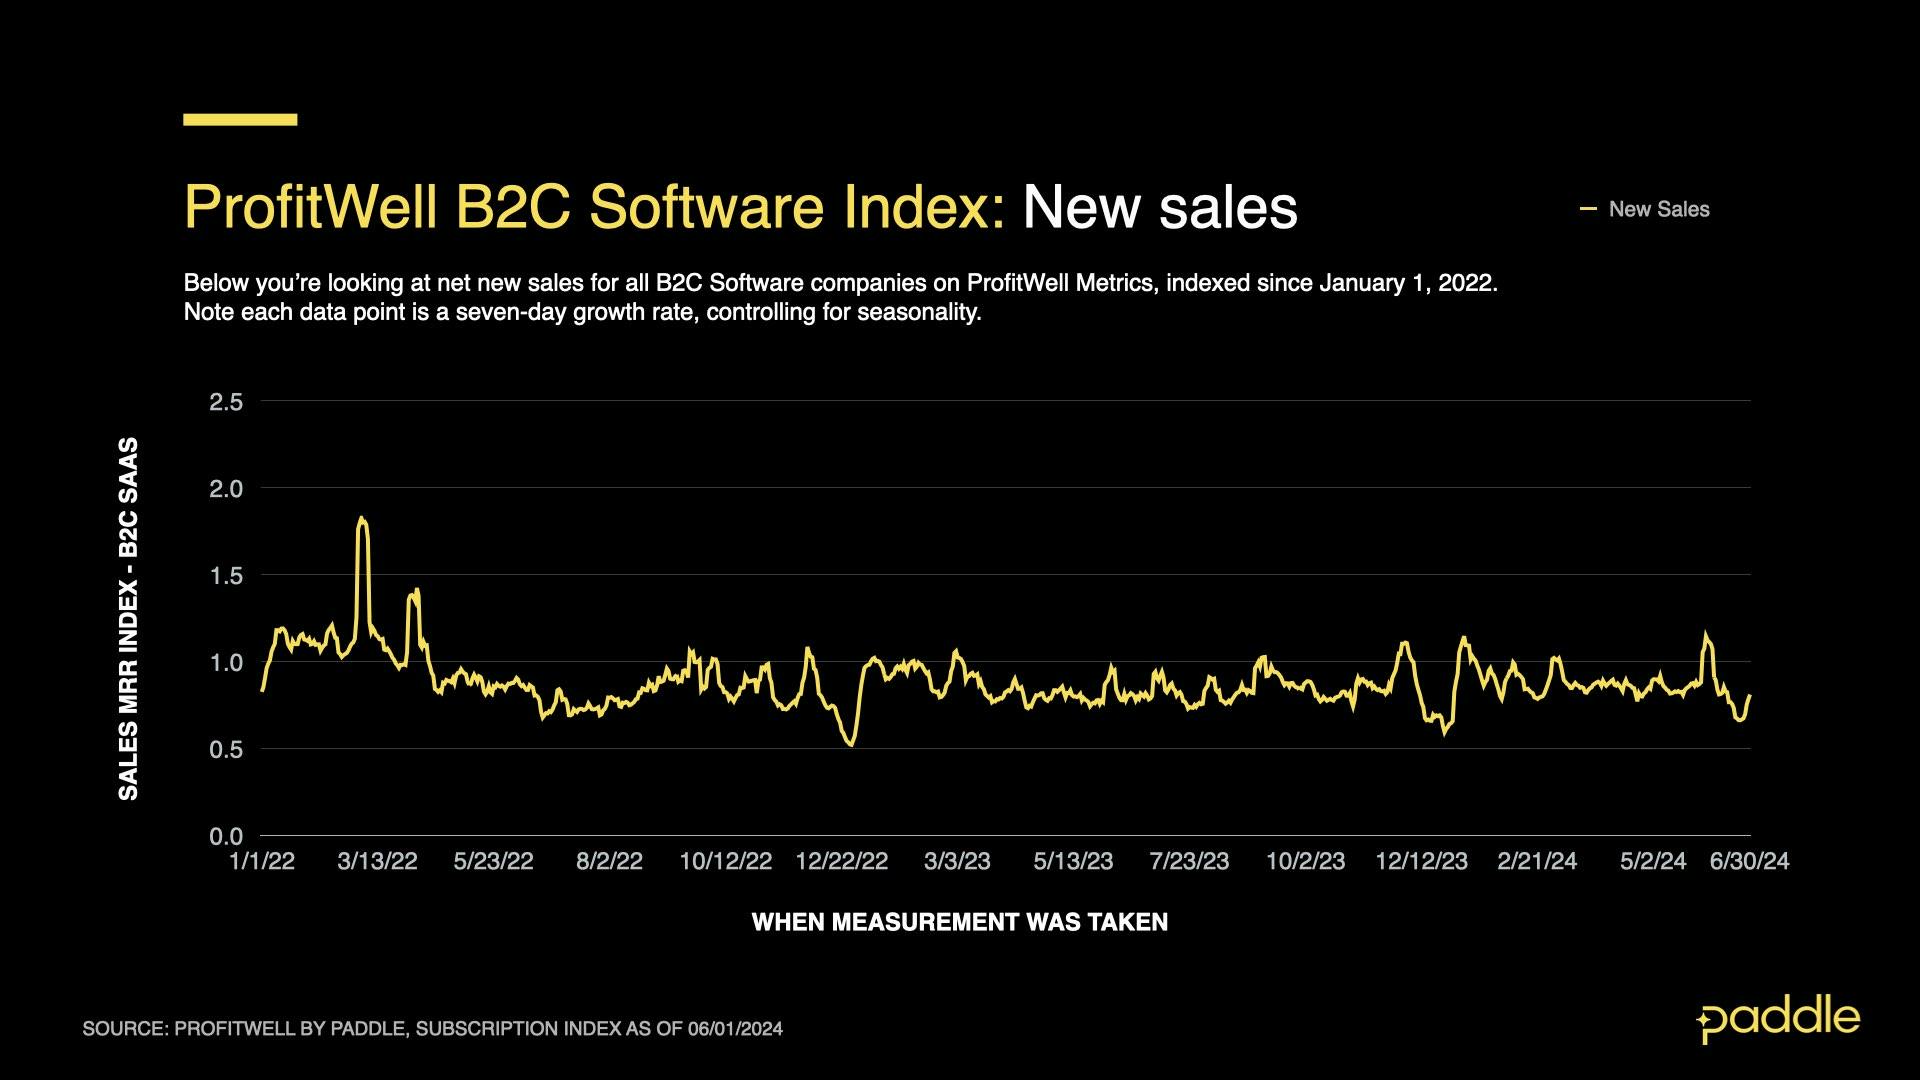
The average New Sales Index dropped by 1.1% in June, to an average of 0.846. This was caused by a week-long, 18.2% dip at the end of the month, with a short-lived 19.3% sales spike at the beginning of June not lasting long enough to counteract the dip.
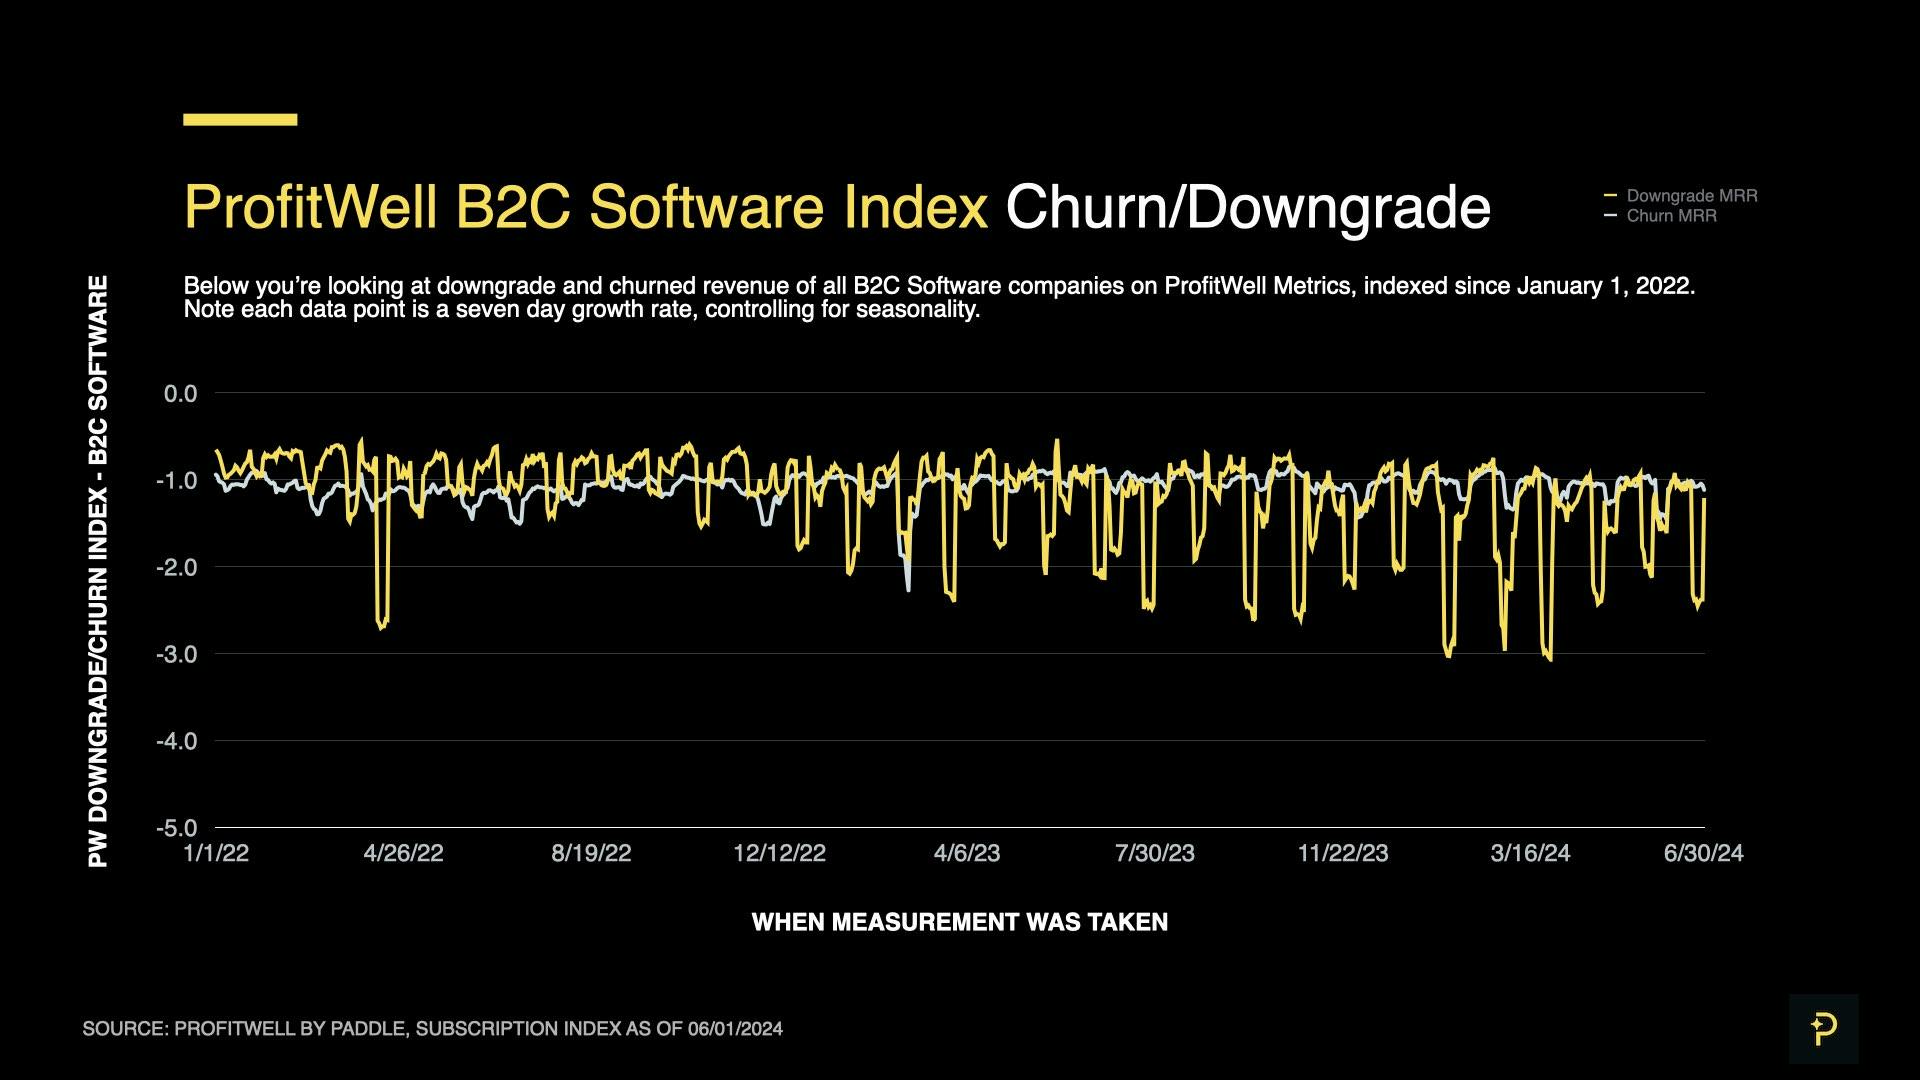
Examining the Profitwell Churn and Downgrade indices, we find churn increasing by 6.3% in June to an average value of -1.130 on the index; and downgrades increasing by 6.9% to -1.478 on the index.
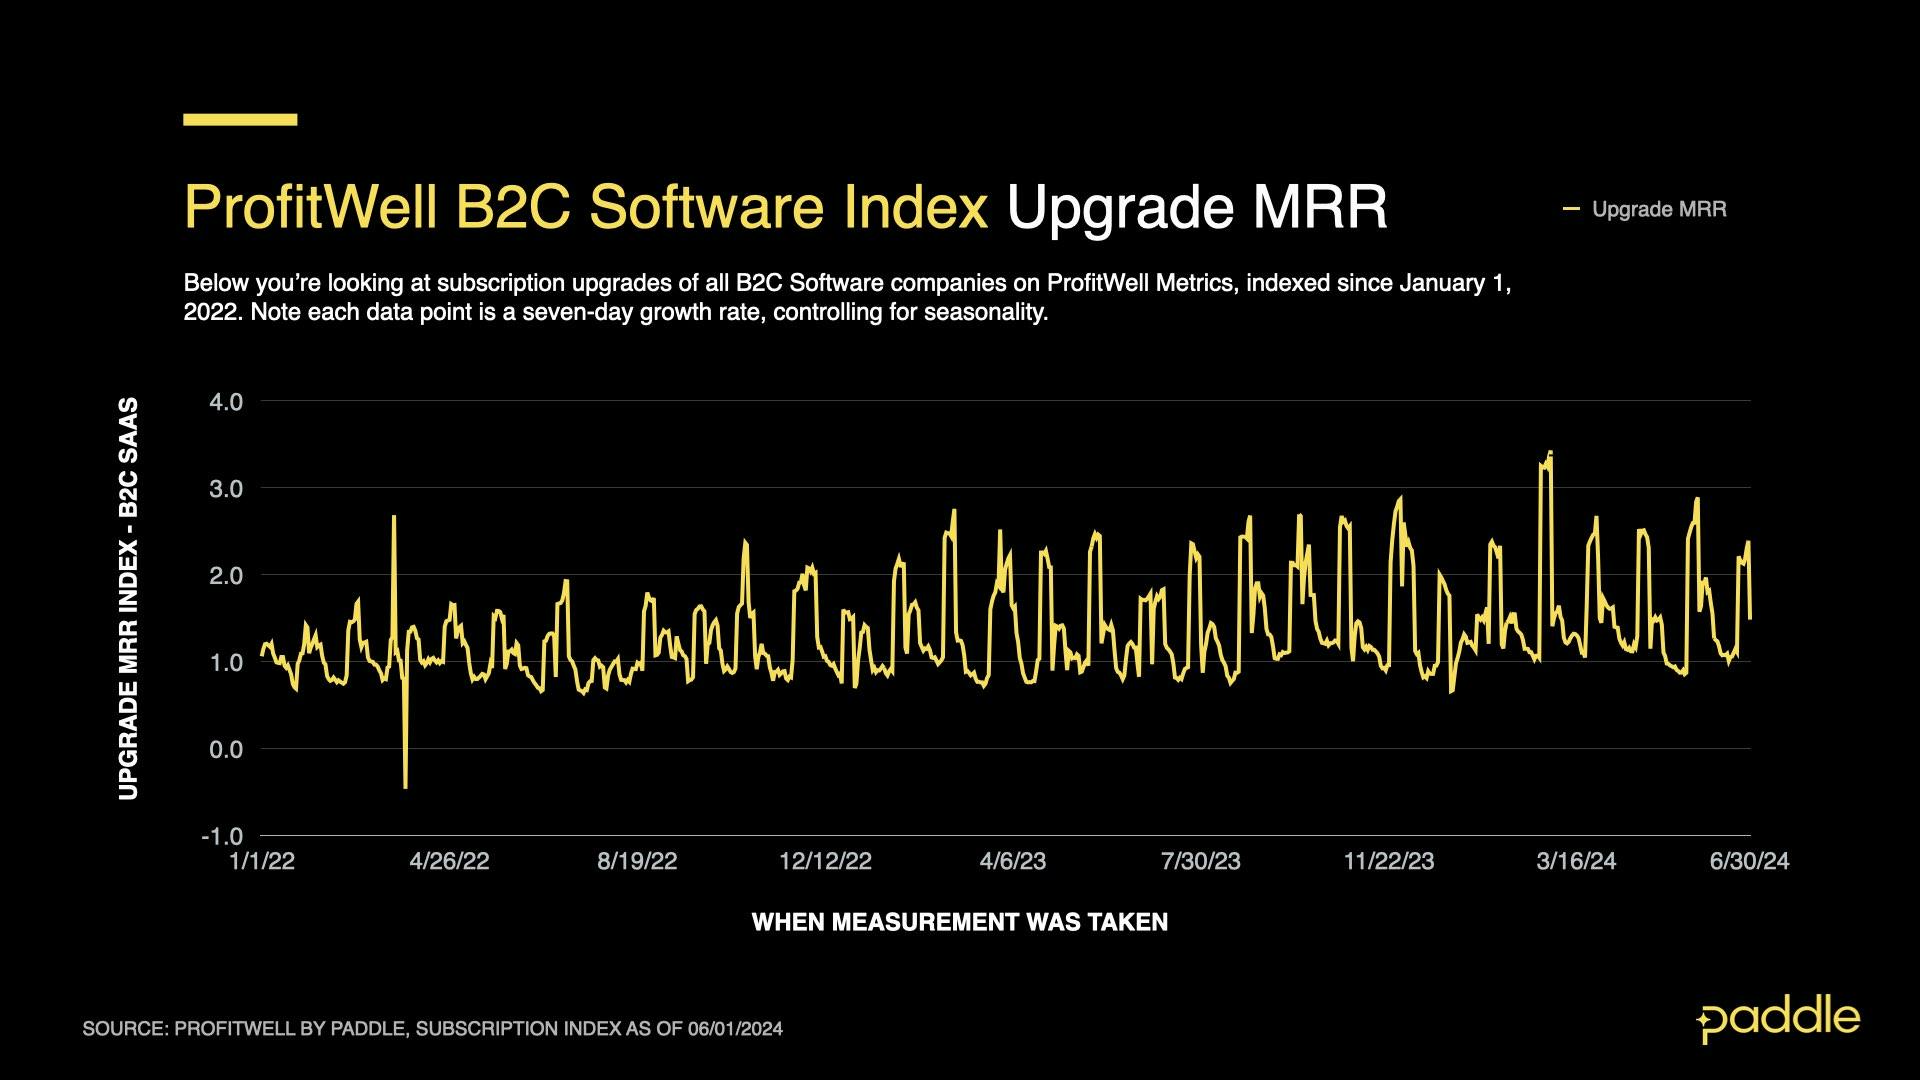
The drop in new sales, and increase in downgrades and churn was counteracted by a 5.2% increase in upgrades, to a value of 1.55 on the index - however, the growth in upgrades was not enough to push June’s overall CAGR into the positives.
A summer slowdown, right on cue

Despite the rapid drop into negative CAGR, we’re almost certain that this slowdown is temporary, and B2C growth will quickly recover to ~8% CAGR for the rest of the year.
Examining the previous 3 years of Profitwell B2C CAGR data demonstrates why - every June & July, CAGR always drops sharply (often into the negatives), before quickly rebounding to previous levels by August.
This slowdown is likely driven by consumers spending less time and money on software in the summer, as they take time off of work & school, spending more on travel, and in-person / physical experiences.
As such, we expect (at most), one more month of depressed B2C growth in July, before B2C CAGR recovers to previous levels and remains near 8% CAGR until December, where we’ll see a similar slowdown as consumers take time off for the holiday season.
H1 2024 SaaS review
Now that June’s out of the way, it’s time for the fun part. How has B2B and B2C SaaS performance in 2024 measured up to previous years?

Comparing the first half of 2024 to H1 in 2022 and 2023, we can see that B2B growth has slowed significantly, while becoming much more stable.
Over the first 6 months of 2022, B2B saw a whopping 49.7% CAGR. This did not last long though, as CAGR steadily dropped over the next two years - and settled at 12.2% in H1 of this year.
Volatility followed the same pattern. The average daily fluctuation (ie, standard deviation) of B2B CAGR was 27% in H1 of 2022, and by the time H1 of this year rolled around, average fluctuation size had nearly halved to 16%.

In fact, the story was the same for consumer subscription businesses. B2C CAGR was 13.2% in H1 of 2022; gradually dropping to 7.1%, in the first half of 2024. Average fluctuation size shrank from 21.6% in H1 2022; to 12.2% in the first half of this year.
So what's going on?

By tracking major economic shifts against B2B CAGR since 2019, we can identify the events that drove SaaS growth over the last few years - and understand how the macro environment will affect SaaS in 2024 and beyond.
Starting in early 2020, COVID caused a flash crash. As lockdowns came into effect, businesses and investors held onto their cash and prepared for the worst - dropping B2B growth from 30% CAGR to -10% CAGR.
In response, the Fed dropped interest rates to near zero and put money directly in the wallets of consumers. SaaS boomed from mid 2021 to early 2022, with the B2B market as a whole almost reaching 50% CAGR, and US VC funding nearly tripling to $100B in Q4 of 2021.
To slow down inflation (peaking at 9% in June 2022); interest rates were steadily hiked, from March 2022 to August 2023, then held constant at 5.33% from August 2023 until now.
As such, 2022 had the sharpest swings we’ve seen in SaaS - with record growth in Q1 & Q2, and a sharp decline in Q3 & Q4; while H1 2024 has been extremely stable, as interest rates were held constant for over a year, and the market settled into a new equilibrium.
Reflecting on SaaS founder sentiment at the beginning of the year, we can see that the 47% of respondents that Crunchbase polled as feeling “upbeat” about their prospects in 2024 had the right idea.

Their hopeful sentiment was echoed by venture capitalists too, as early stage funding in the EU grew by 38%; after the startup ecosystem endured nearly 2 years of flat or declining deal value.
So what's in store for the rest of 2024?
The stable interest rates, and equilibrium that B2B and B2C have reached, allow us to confidently forecast a growth rate of 11% CAGR for B2B and 8% CAGR for B2C - at least until the end of the year.
Examining the forces that drive B2B & B2C revenue, it becomes even more apparent that SaaS revenue growth will remain stable for the rest of the year.

New sales, churn, upgrades and downgrades have hovered near stable averages since the beginning of 2024, with no clear upwards or downwards trends.

Barring any new disturbances to the economy, the only deviations to SaaS growth we can foresee are a temporary dip in SaaS spending in December (as businesses slow down for the holidays), before a quick recovery in January 2025.
That said, there are rumours of the Fed dropping interest rates later this year (as inflation reached a 3-year low of 2.97% this June). If this is the case, our growth predictions may be conservative, and B2B and B2C CAGR may climb above 11% & 8% CAGR respectively.
Strategies for H2 2024
With a stable, conservative growth forecast, and the possibility of a slowly accelerating economy (if interest rates are lowered), it’s important to hold on to the discipline that your company built in 2023.
Even if SaaS picks up again, the fundamentals still apply, and remaining focused on what matters will put your company in a position to outgrow your competitors if the market gets red hot again (hopefully without the pandemic this time).
Here are a few things to consider
Your current customers are the key to growth
Acquiring new customers is almost always more expensive than expanding your relationship with your existing ones. There are many ways to approach this, but some of the lowest hanging fruits are:
- Cross selling your customers into different products. On top of additional revenue, this will increase the stickiness of your product, and significantly reduce churn.
- Upselling customers to larger plans. This is easier than it looks, especially with an effective product led-growth strategy. Effective monitoring of product usage creates “natural” upsell opportunities that will more effectively convert.
- Switching to usage or outcome based billing. If you understand the key value drivers in your product, implementing a price based on the value your customer receives from your product can lead to much higher ARPU.
Check out this article for a guide to different pricing models, and the opportunities for upsells, cross sells, and usage based pricing that they create!
Keep a pulse on your most important metrics
The key to outgrowing your competitors over the long-term is building the most efficient business. This means keeping a close eye on your core subscription metrics, even if the market is stable.
One of the most important questions to ask yourself as you track your subscription revenue is “am I tracking (and optimizing) the right metric?” It’s easy to forget that metrics are a merely a proxy for reality, and many SaaS operators fall for the trap of optimizing the wrong metrics, at the expense of their larger goals.
It often takes many rounds of experimentation to find the right metric to focus on. Is it net revenue retention or ARPU that will have the greatest impact on your revenue?
Profitwell Metrics is the best way to speed up your hunt for this north star metric. It offers industry-leading analytics out-of-the-box, so you don’t need to waste time building custom tables or double checking how a SaaS metric is calculated each time you want to run an experiment - and it’s completely free.
Seek out growth by selling globally
While SaaS is growing more slowly these days in aggregate, certain regions are growing more quickly than others. In fact, we’ve seen growth rates nearly 3 times that of the US, in western, and southern Europe.

Breaking into new regions is easier said than done though, especially with tax regulations, payment providers, and reporting requirements differing by region - but it’s not impossible either, when you team up with the right partners.
If international expansion is on your radar, check out this webinar with Elena Verna, and Paddle CMO Andrew Davies for a comprehensive guide on unlocking international SaaS growth!
We publish monthly reports on the ProfitWell Subscription Index to show you where the market is headed — and help you form strategies to respond. All backed by data from the 34,000+ companies on ProfitWell Metrics.
Missed our previous market reports? You can find them here
Subscribe below to be the first to receive the next SaaS Market Report.

Get started with ProfitWell Metrics
Keep your finger on the pulse of your subscription business, with revenue reporting that updates in real time. 100% free.