B2B SaaS revenue grew slightly faster in September, as companies pushed to close Q3 deals — typically the last strong month for sales before the end of the year.
Churn's impact increased slightly, but was outweighed by the higher sales.
This is the latest in our ongoing SaaS market reports, which track the movement of the ProfitWell B2B SaaS Index, and its underlying growth and retention trends. Subscribe to the Paddle newsletter to get these updates in your inbox.
MRR growth increased to 8.4% in September
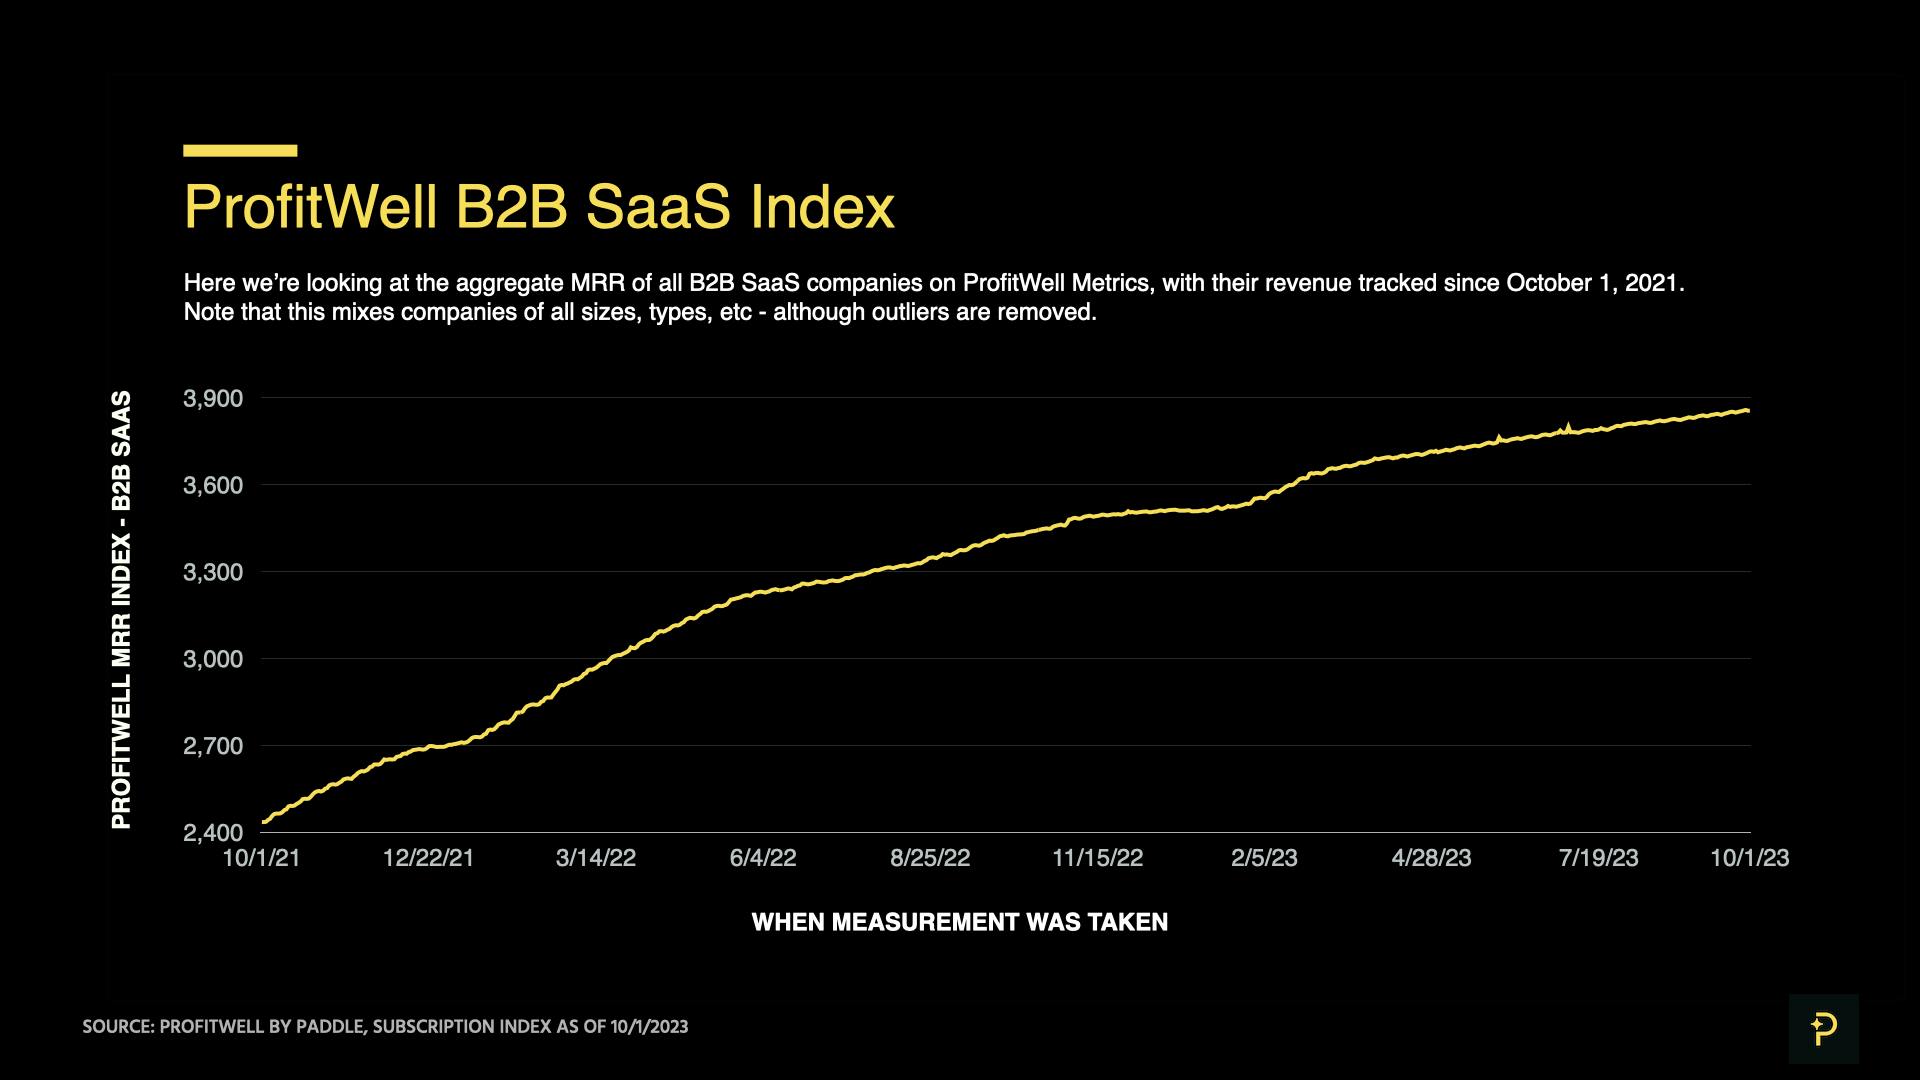
The ProfitWell B2B SaaS Index tracks the cumulative monthly recurring revenue (MRR) from a sample of the 34,000+ companies on ProfitWell Metrics. By measuring the revenue performance of this cross-section of companies over time, we can objectively observe how quickly the sector is growing (or not). The index does not adjust for inflation.
Explore the free demo of ProfitWell Metrics here.
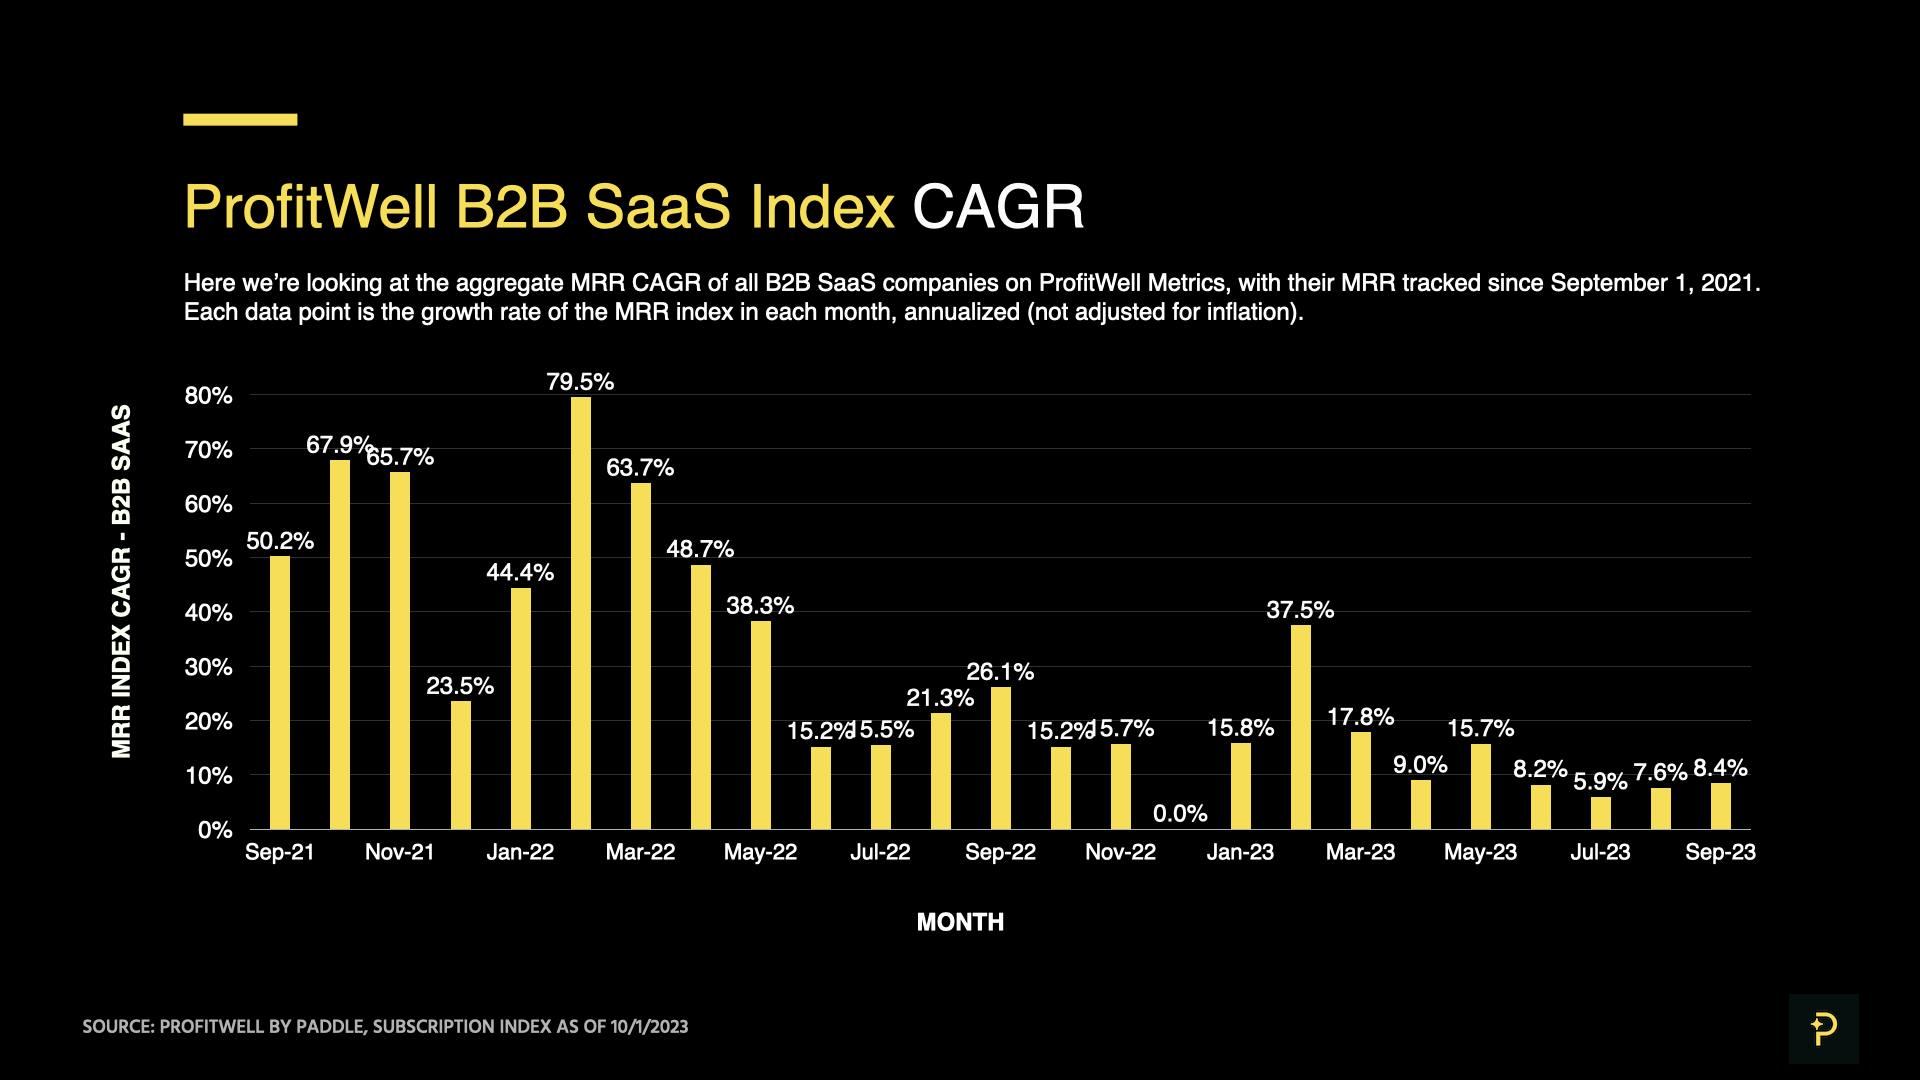
The ProfitWell B2B SaaS Index increased at a compound annual growth rate (CAGR) of 8.4% in September.
This is a moderate uptick from the months of July and August, when MRR grew at rates of 5.9% and 7.6% respectively.
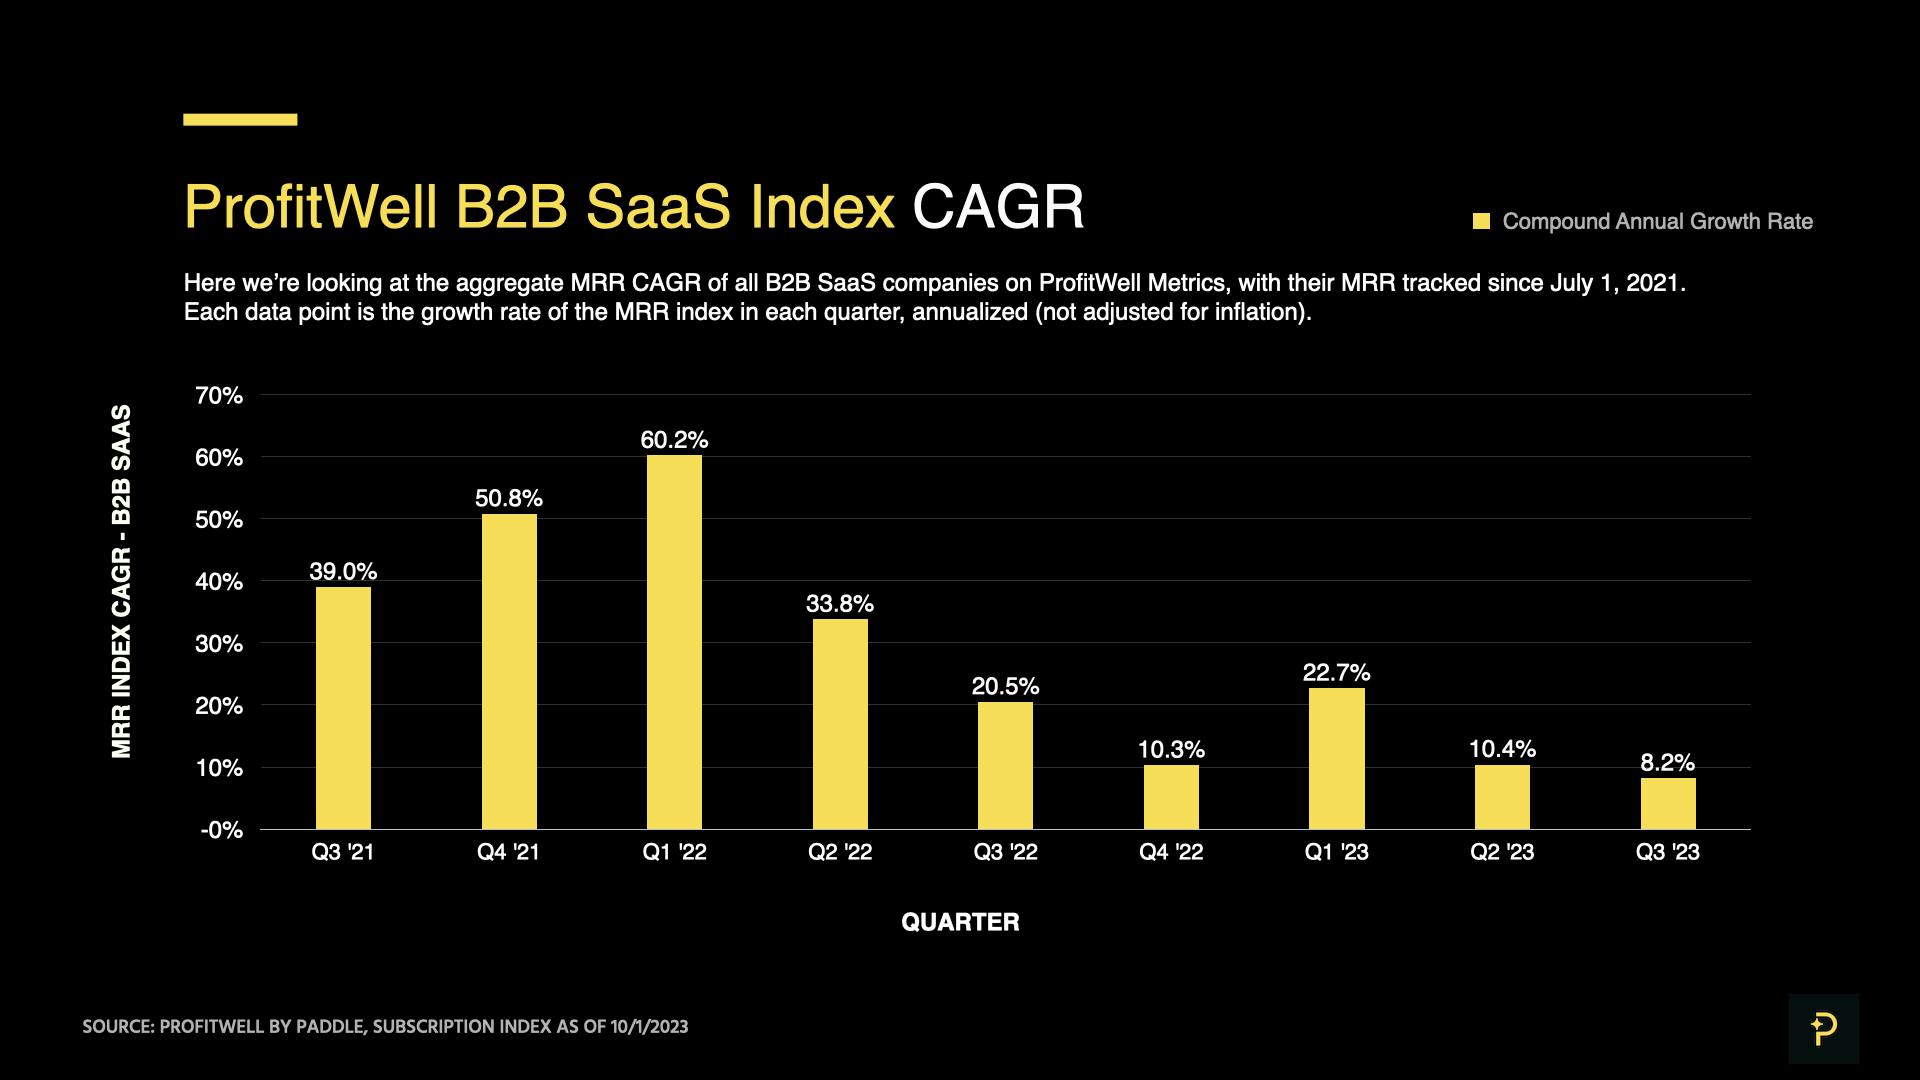
This growth nets out to a CAGR of 8.2% in Q3 2023, a slowdown from growth rates of 10.4% in Q2 and 20.5% in Q3 last year.
So while the SaaS industry’s performance in September was better than the anemic rates seen over the summer, it shows more evidence of a general slowdown since the heights of the pandemic.
Between about Q2 2020 to Q2 2022, we estimate SaaS revenue packed about three years of growth into two years. But with the now-widespread adoption of remote work and higher capital costs, it now appears that growth of about 8% (or lower) is more the norm.
Q4 is typically known as the weakest quarter for SaaS growth, when fewer sales close and churn hits harder. We’ll likely see revenue growth go below 8% over the next three months.
September’s uptick was driven by moderately higher monthly sales
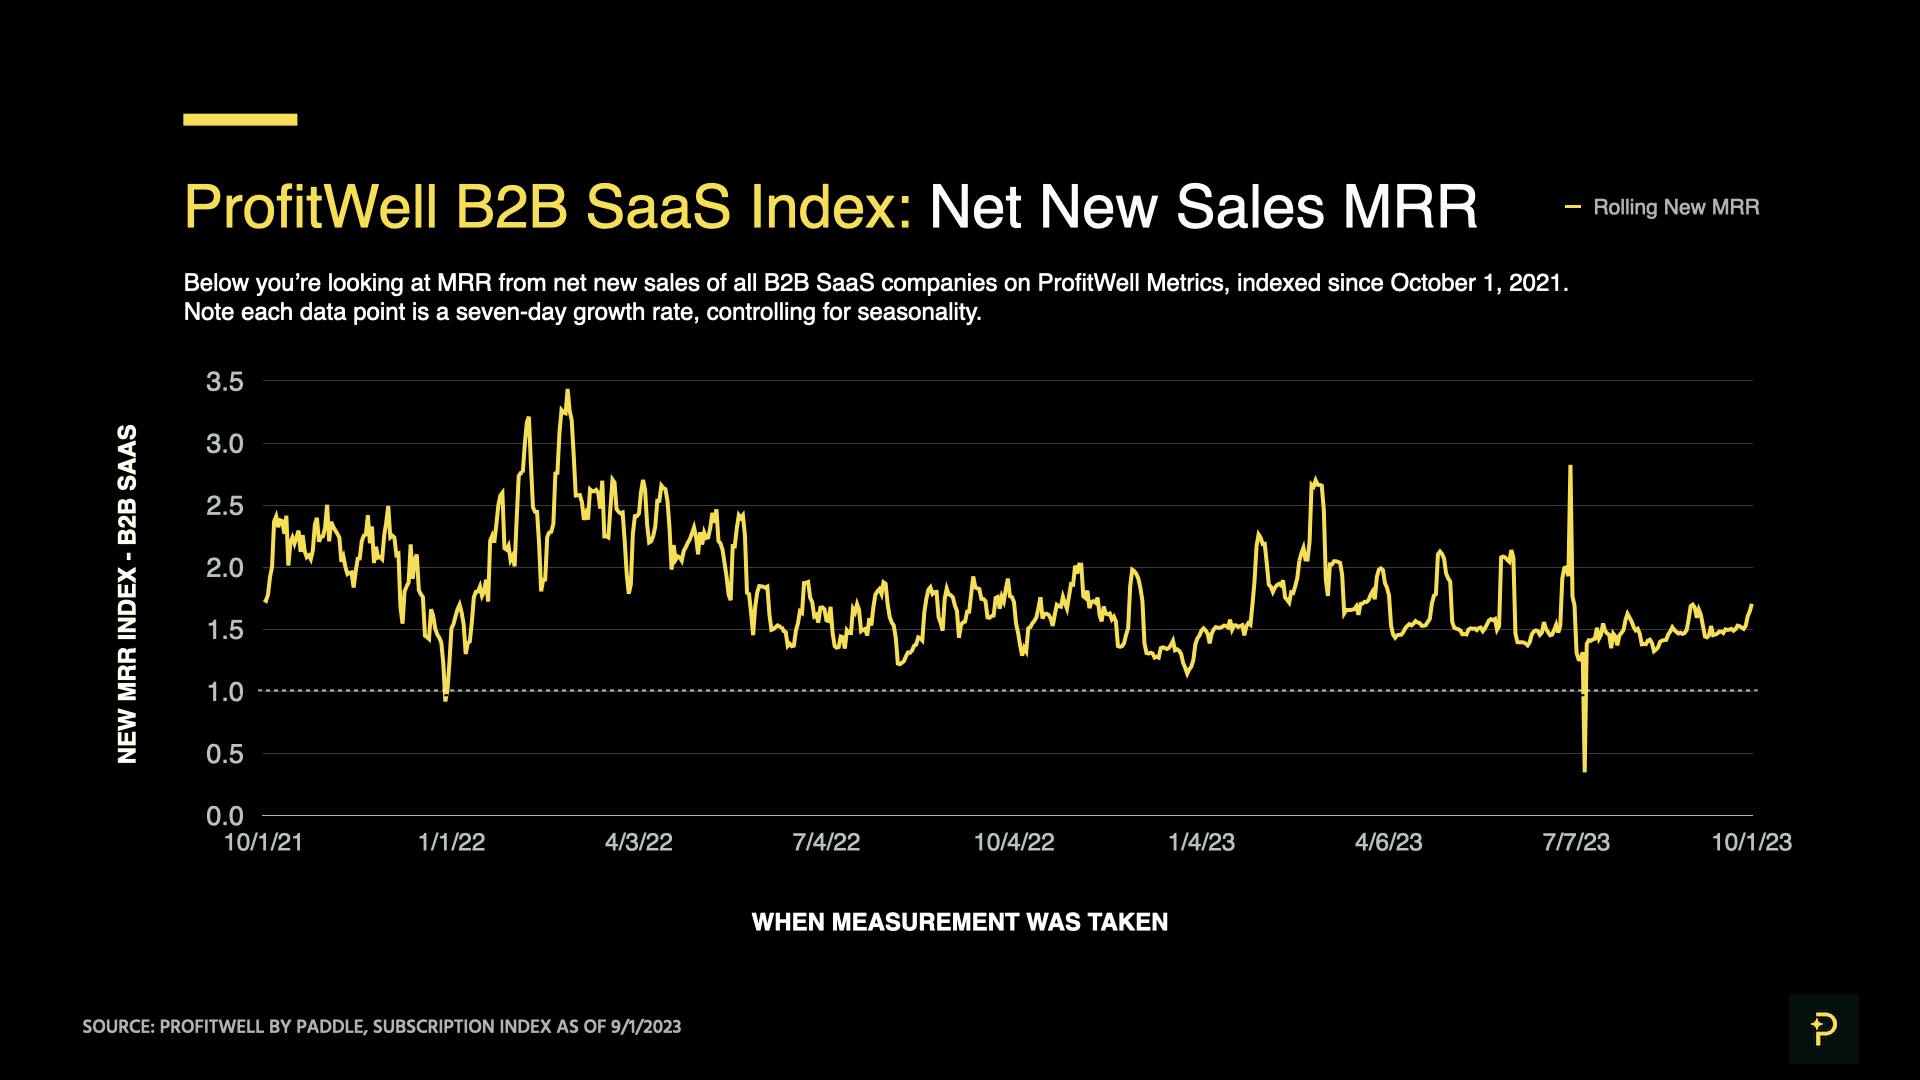
The ProfitWell B2B SaaS New Index is a seven-day rolling average of MRR from net new sales, expressed as a multiple of typical daily sales in 2019. A 1.00 index reading represents sales on an “average” day in 2019, while a 1.10 reading would be 10% higher sales (the ProfitWell B2B SaaS Churn Index is calculated similarly, but will be negative, with -1.00 being an “average” 2019 figure).
Because these indices are seven-day averages, they should be read as directional indicators and not direct inputs into the main SaaS index.
The ProfitWell B2B SaaS New Index averaged 1.53 in September, a 5.2% increase from August.
As expected, this was the highest month of Q3 for sales to new customers, as sales teams made their final push for bookings before the end of the quarter.
You should expect October and November to see marginally lower sales compared to September, before a 10-15% drop in December.
Customer retention didn’t change significantly
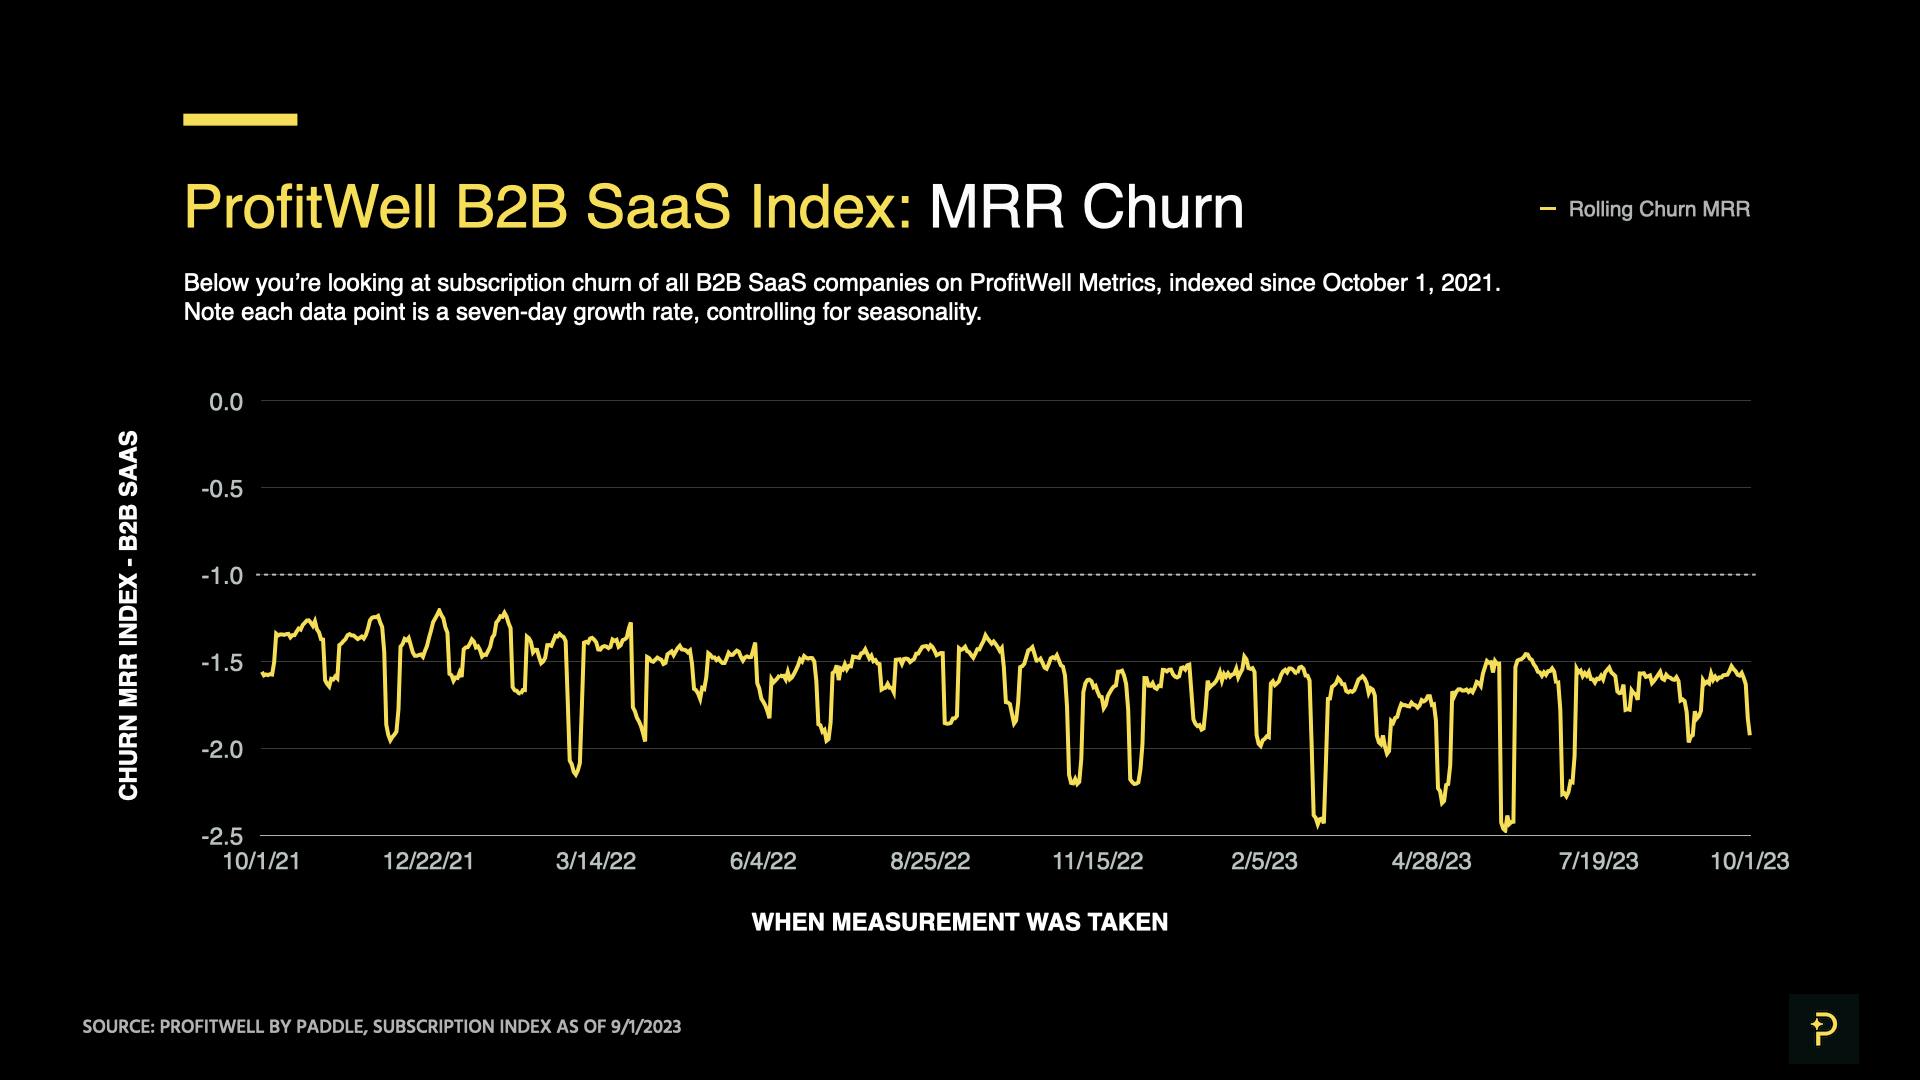
September revenue churn was similar in volume to the levels we saw in August.
The ProfitWell B2B SaaS Churn Index averaged about -1.66 in July, showing that nominal churn was 1.1% higher than in June.
From 2020 onwards, we’ve seen churn stay about the same from September to October, before worsening in November and December — as companies trim costs during their annual planning cycles. Due to slower forecast SaaS growth in 2024, we expect November and December churn to be at least 10-15% higher than the levels seen in September.
It's already Q4. What now?
This late in the year, your available growth levers often fall into two categories: tactical improvements that can be implemented by December 31, and strategic plans that will become part of your 2024 roadmap.
First, put together a Q4 retention action plan.
Lots of customers will be reviewing their expenses and deciding which solutions to keep. The best time to prevent them from churning is before they make that decision, not after.
Review your product engagement and health score data to find users who’ve become less engaged. Target them with enablement or support resources so that they can get some value out of your product.
Reach out to your largest customers to assess their satisfaction. For those who’re at risk of leaving, also give them enablement or support. For those who’re happy, look for opportunities to drive expansion revenue by upgrading them to premium features, or by packaging an add-on product or service for them — that is, a niche offering for which a proportion of customers have a high willingness to pay.
Finally, create salvage offers for customers that are close to canceling. These are options like discounts, a free month, or a pause plan — anything that keeps customers within your product instead of losing them forever. It’s usually easier to re-engage an existing customer than find a new one.
Second, take the opportunity to review your pricing strategy.
Our recent data shows that in 2023, SaaS companies are increasingly leveraging their pricing and packaging as a way to improve performance, without having to invest significant capital in sales and marketing.
Of these, the most sophisticated operators are using a value-based pricing approach: measuring how much customers value each part of their product, and identifying the customers with the highest willingness to pay. This approach helps companies find where they have leverage to increase current prices, while clarifying which product improvements will drive the most long-term value for customers.
In our report on the State of B2B SaaS Pricing in 2023, we analyzed data from hundreds of B2B pricing leaders to learn how they’re making pricing decisions, and which pricing and packaging strategies they’re employing. You’ll find insights on:
- North Star metrics preferred by SaaS pricing leaders
- Common inputs to the pricing research process
- The most common free product offers
- And more
By the end, you’ll have a picture of how your strategy compares with the market, and some ideas for how to differentiate yourself from the competition in 2024.

Finally, review industry benchmarks and start forecasting for 2024.
As SaaS growth has slowed, we’ve spent 2023 scrutinizing data from throughout the industry to monitor how the market’s changing — and how to succeed in these conditions.
We analyzed the 34,000 companies on ProfitWell Metrics, gathered SaaS benchmarks from hundreds of executives in partnership with OpenView, and surveyed hundreds of B2B pricing leaders alongside the Price Intelligently team.
We’ve found that:
- Startups are more heavily impacted than large companies
- Operators are looking to growth levers they’ve previously ignored
- Investors increasingly value efficiency over growth
- Developing markets are expanding faster than developed ones
Join me for our SaaS Happy Hour on October 31st, where I’ll go deep on our analysis throughout the year, and discuss where we see the market headed in 2024. We’ll also have lots of time to chat SaaS analytics, and how to get the most out of ProfitWell Metrics.

We publish monthly reports on the ProfitWell Subscription Index to show you where the market’s headed — and help you form strategies to respond. All backed by data from the 34,000+ companies on ProfitWell Metrics.
Missed our previous market report from August 2023? Read it here.
Subscribe below, and be the first to receive the next SaaS market report.


